
Key Takeaways:
- Stellar (XLM) gains over 23% in a week despite a short-term correction.
- Price action shows signs of consolidation above key support at $0.45.
- A breakout from the bullish flag hints at a potential rally toward the $1 mark.
Stellar (XLM) is currently at $0.4671, with the 24-hour volume at $1.16 billion and the market capitalization at $14.54 billion. Down by 4.91% in the previous 24-hour span, the altcoin experienced a strong 7-day run with a growth rate of 23.36%.
This suggests an undertone of bullish sentiment while the market grapples with volatility and short-lived declines. A 7-day candlestick chart reflects the story of fast-paced movement.

The week began with a firm bullish impulse, driving the price through the $0.52 level with the backing of strong volume, a hint at increasing investor interest. But the rebound was countered with swift selling pressure.
A string of red candles unwrapped the move of profit taking, driving the price below $0.47. Fortunately, the token managed to find support in the vicinity of the $0.45 region, thereby capping further loss.
XLM Consolidates Between Key Price Levels
Following the retracement, XLM settled into a position of range-bound action. The price varied narrowly between $0.45 and $0.47, implying an area of consolidation.
Narrow-bodied candlesticks and declining volume show market indecision, bulls and bears are yet to establish dominance. A short-lived breakout bid above $0.50 was rejected in the form of long upper wicks, further reinforcing resistance at the same level.
Despite the correction, Stellar’s success in staying above its $0.45 base is a positive sign. This area is becoming a key support area. While the price stays above it, XLM still has a neutral-to-bullish configuration.
A confirmed breakout above $0.50 with volume could be the beginning of a new bull leg. A breakdown below $0.45 could see XLM drift down to the $0.42 area.
Also Read: Stellar (XLM) Poised for Breakout as Technicals Align with Bullish Market Momentum
Bullish Flag Breakout Supports Rally Potential to $1
Popular crypto analyst Ali just released a Stellar long-term chart that offers more bullish optimism. The chart shows a typical bullish flag structure, a strong initial breakout between early 2024 and mid-2025, and a sloping correction.
A stated breakout occurred sometime in mid-July 2025, and this could imply the probable continuation of the trend. Relative to the technical flag theory, the price target is estimated by taking the height at the opening flagpole and adding it to the breakout level.
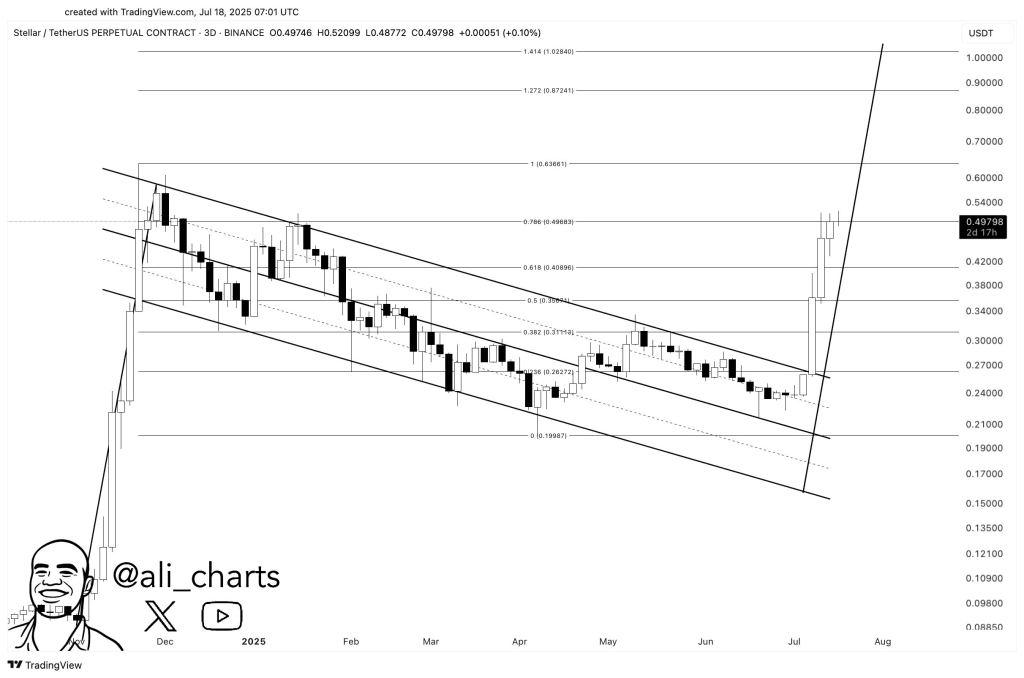
This supplies the following upside target at around the $1 mark. Though the final move depends upon the larger market action and follow-through volume, the pattern further solidifies the probability that Stellar is heading for a gigantic breakout.
Also Read: Stellar (XLM) Price Gains Momentum With $0.60 Target in Sight
Disclaimer: This article is based on real-time market data and general technical observations. It does not constitute financial advice. Always conduct your own research before making investment decisions.