
XRP price analysis on Tuesday, May 19, remained focused on a tight technical range as traders awaited clearer breakout confirmation. Analysts cited compressed volatility, weak upside follow-through, and key support zones within a broader corrective structure.
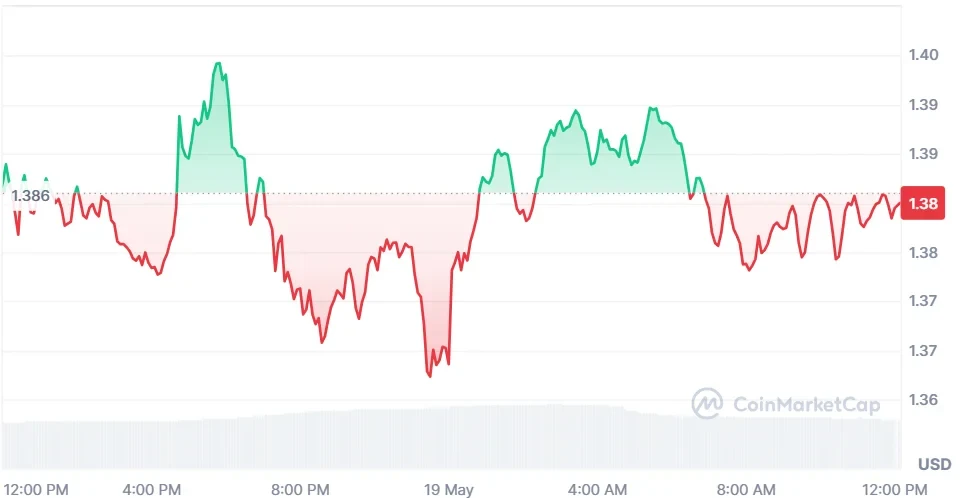
As of writing, XRP trades at $1.38 after a 0.21% daily decline, while weekly losses reached 4.89%. CoinMarketCap data shows that the trading volume rose 5.81% to $1.95 billion as traders watched a narrow technical range for clearer confirmation signals.
Also Read: Solana Price Faces Key Rejection at $98 as Downtrend Pressure Builds
XRP Price Analysis Puts $1.80 Target in Focus
Ali Martinez, a crypto analyst, highlighted that XRP is on the verge of a major price swing. He noted that the XRP price analysis showed the tightest Bollinger Band squeeze on the 3-day chart in over a year.
When volatility compresses strongly, Martinez indicated, that is normally a sign of a sharp price expansion ahead. He said that the current zone was a range that was a no-trade area because XRP is still not confirming direction.
The analyst is waiting for a pure 3-day candlestick price break above $1.50 or below $1.29. A close above $1.50 would support a move toward his main target at $1.80.
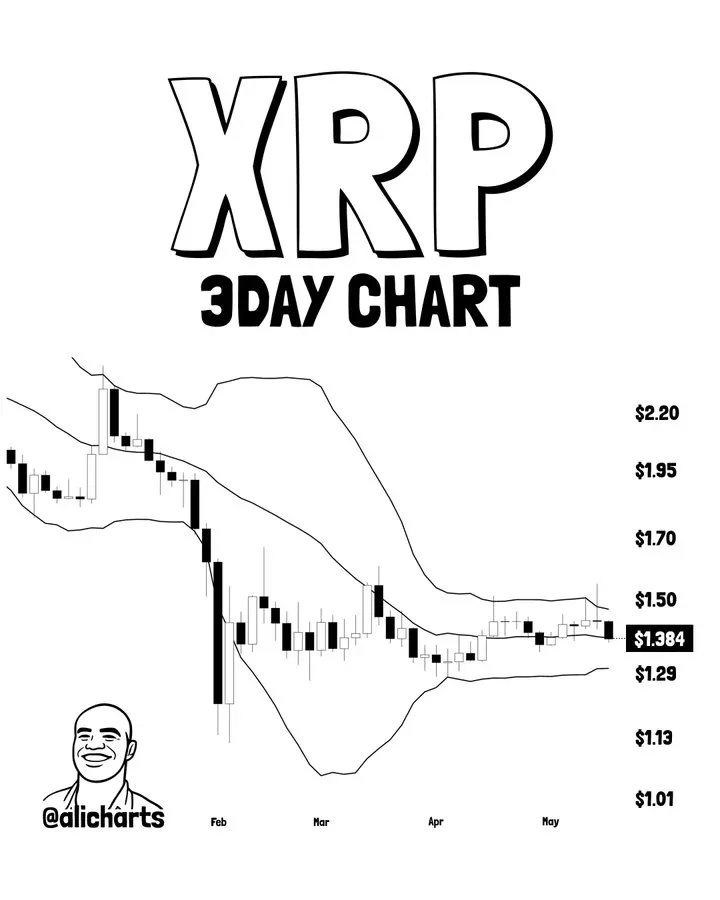
The analyst said that a close below $1.29 would undermine the near-term bullish scenario. The move might set the stage for a further pullback to the psychological $1 support level.
XRP Price Analysis Shows Corrective Triangle Structure
Moreover, another analyst, More Crypto Online, mentioned that XRP is still trading within a large corrective triangle following a failed upside breakout attempt.
The analyst also noted that the rise was not backed by impulsive strength and the general range-bound scenario would be maintained for the time being.
The recent move up showed no impulsive action. This means the broader range-bound perspective is still in play.
Under the leading scenario, XRP may continue to form a larger triangle structure. Analyst added that there is a possibility of another upside move later in a C-wave.
The next resistance levels stand at $1.55, $1.60, and $1.66. If XRP shows strength within the existing structure, then these levels will continue to be the primary upside regions.
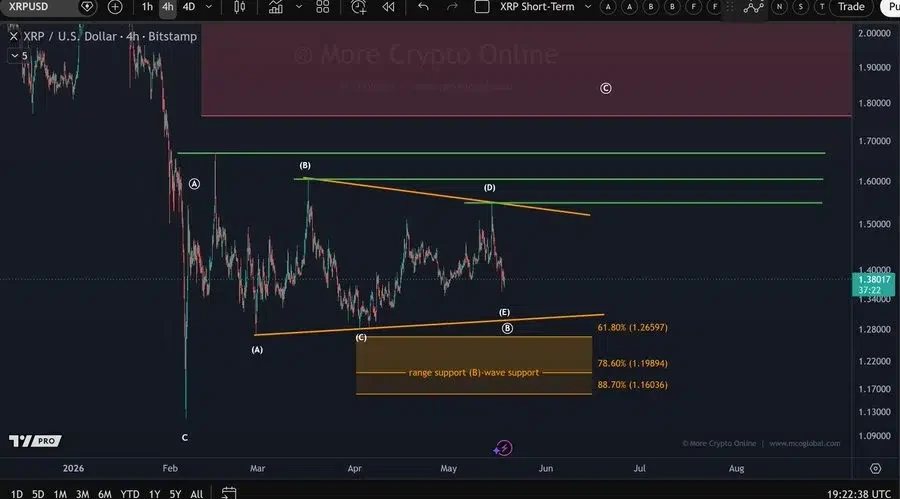
The risk scenario is around the $1.28 support zone. The broader triangle would weaken significantly if XRP falls below that level.
Support is around the $1.30 price level before this breakdown. The wider range of support is in the $1.16 to $1.26 zone.
Futures Volume Falls as Open Interest Rises
CoinGlass data shows weaker derivative activity. The future volume declined 4.57% to $3.01 billion, while open interest increased 0.41% to $2.79 billion.
The XRP OI-weighted funding rate stands at 0.0054%. This indicated positive funding and a slight rise in open interest.

As per the XRP price analysis, the token is still in a tight decision zone. The next confirmed move beyond the resistance or support level could mark the beginning of the next major trend.
Also Read: XRP ETFs Record $60M Weekly Inflows, Highest in 2026