
XRP price is consolidating after a strong weekly rally, holding within a key accumulation zone. Technical indicators show neutral RSI and weakening MACD momentum, suggesting sideways market conditions. Despite short-term pressure, the broader bullish structure remains intact, supported by growing institutional adoption and tokenized finance developments in Japan.
XRP Price Weekly Breakout Consolidation Phase
XRP price on the weekly chart completed a strong impulsive rally before entering an extended corrective phase. Wave III pushed the price above $3.00, but momentum later weakened.
Current price action reflects Wave IV consolidation, with traders positioning for the next major directional breakout move.
According to the crypto analyst More Crypto Online, the orange retracement region between $1.21 and $1.55 acts as the primary accumulation range for the XRP price.

Holding support keeps XRP price bullish continuation possible, while a reclaim of $1.55 may trigger upside targets at $1.78, $2.05, $2.36, $2.87, $3.40, $5.00, and potentially $6.00 if Wave V develops with strong momentum and renewed market participation.
The lower brown zone marks deeper correction targets near $0.99, $0.74, and $0.49, historically common retracement levels during crypto bull cycles.
Weekly candles show compression and fading volatility rather than reversal confirmation. XRP’s long-term bullish structure remains intact unless the macro higher low support breaks decisively.
Also Read: XRP Price Eyes Explosive $12 Rally as Historical Support Zone Holds Strong
XRP Technical Indicators Show Consolidation Phase
Price compression is followed by XRP’s technical indicator being consistent with the consolidation period. The Relative Strength Index (RSI 14) has a value of 47.60, whereas its moving average comes to 49.61.
The RSI stays under the 50 mark, meaning that the buying pressure is becoming weaker. There is currently no significant trend in price momentum.
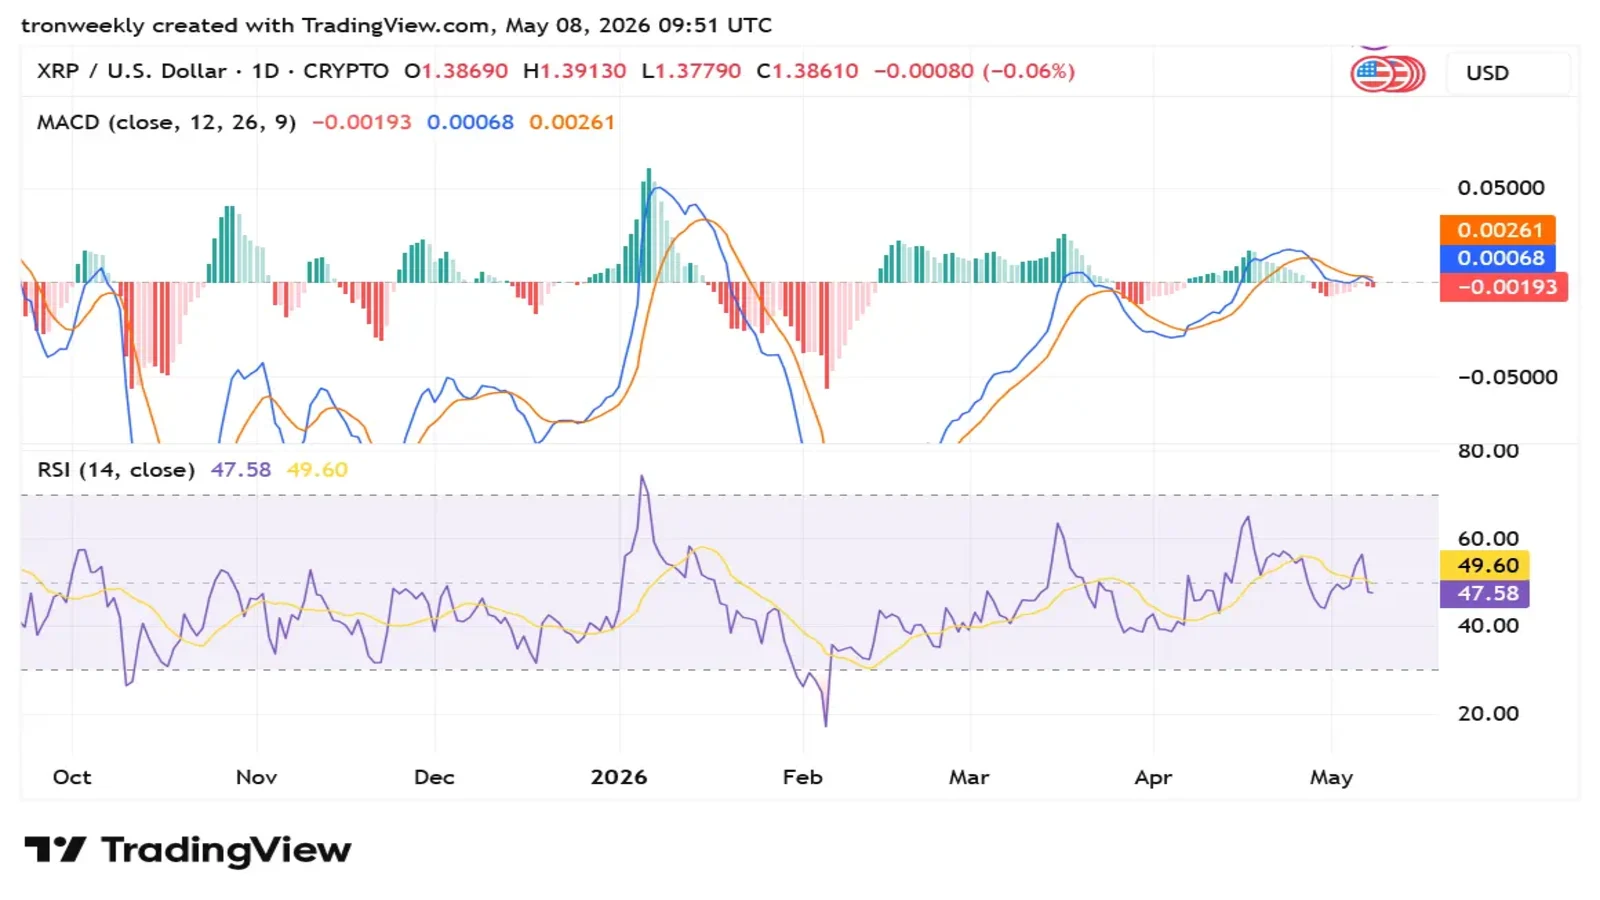
MACD indicates a weak bearish setup since the MACD line is at 0.00069 under the signal line at 0.00261. The MACD histogram is at -0.00192, indicating the loss of bullish momentum.
There are low levels of momentum near the zero line, implying that a market range formation is forming.
Institutional Adoption Supports Long-Term Outlook
Extending from technical stability into fundamentals, the XRP Price outlook is also being influenced by growing institutional adoption.
SBI Holdings, an XRP partner, had already issued blockchain-enabled bonds with XRP-based incentives, which played a role in boosting the adoption of blockchain technology in Japan among institutions and in linking conventional financial instruments with crypto assets.
With Japan heading towards the use of tokenized government bonds using blockchain-based financing concepts from SBI Holdings, there may be a likelihood that this could lead to a rise in demand for the XRP ecosystem. This could give a boost to the price of XRP.
This article contains market analysis and price predictions. These are not guarantees. Crypto markets are volatile. Always DYOR. Not financial advice.
Also Read: UBS Reveals $1.5M XRP Holdings Explosive Position