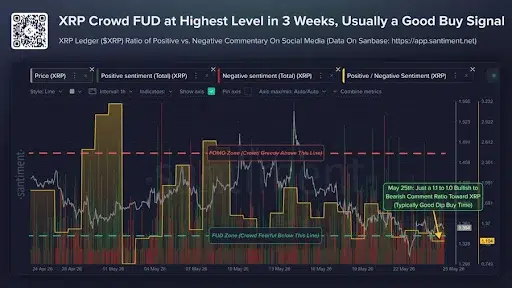
Fear surrounding the XRP price has climbed to its highest level in nearly three weeks, according to fresh data shared by Santiment and market watcher CW.
The latest sentiment readings show traders turning increasingly cautious even as the XRP price continues holding near the $1.35 region without suffering a major breakdown.
Santiment’s chart represents the ratio of the sentiment expressed in social media posts for XRP, with positive being represented by the blue line while the red line denotes negativity. On May 25, the bulls-bears ratio dipped to around 1.10 to 1.0, thus pushing XRP into the “FUD Zone.”
Source: X
The past shows that periods marked by extreme fear on the part of investors towards XRP usually have a contrary implication. Falls into such an area usually rebound eventually, owing to reduced selling pressure and increased buying.
The XRP price did not decline further despite extreme pessimism on the part of investors. Currently, the market participants pay attention to the fact that the XRP price has not experienced any significant falls amid negative investor sentiment.
Also Read: DASH Price Prediction: Bullish Triangle Signals Potential Breakout to $53
XRP Price Traders Face Deep Unrealized Losses
According to Santiment Intelligence, the average XRP trader who has been trading for the past 30 days has decreased by 47% on average.
Traders appear to have cashed out at local lows after suffering losses through various drops that have nullified profits made during late 2024 and early 2025. The MVRV of 30 days is now lower than it was even in December 2020, making XRP an “extreme opportunity zone.”
The MVRV ratio reveals how much the traders are winning or losing. Extremely low ratios mostly represent fear and despair among normal retail investors. This has been seen in previous instances where XRP has hit its bottom point.

Source: Santiment Intelligence
Despite all the losses, many people have still remained optimistic about the future of XRP due to regulatory success by Ripple, ETF speculation, and more uses of its payments platform.
Historical XRP Cycles Suggest Accumulation Phase
The most recent charts indicate that there is an ongoing downtrend when it comes to the price levels observed in previous peaks for the asset.
The current MVRV ratio for the crypto is significantly negative, thus suggesting that the cryptocurrency may be in a period of accumulation rather than reaching a market peak.
Also worth noting is the discrepancy in actions undertaken by traders and the behavior of the XRP price. Despite profits for traders having declined, XRP managed to hold its value well above major support points and not experience an instant fall.
History shows that in such situations, selling activity tends to be minimized since less profitable players exit the market. Low values of the 365-day MVRV indicated that long-term investors did not have any substantial gains.
This article contains market analysis and price predictions. These are not guarantees. Crypto markets are volatile. Always DYOR. Not financial advice.
Also Read: Arbitrum Price Analysis: Falling Wedge Breakout Hints at a Rally Toward $0.131