XRP price is trading within a broader range, reflecting a temporary bearish bias, although the technical picture is intact. The current retreat is perceived as corrective, not bearish, with early indications that momentum may gradually build up if support holds.
At press time, the XRP price is trading at $1.43, with a 24-hour trading volume of $3.09 billion and a market capitalization close to $88.53 billion. The XRP price has fallen by 2.53% over the last 24 hours, showing a short-term correction after recent upward attempts.
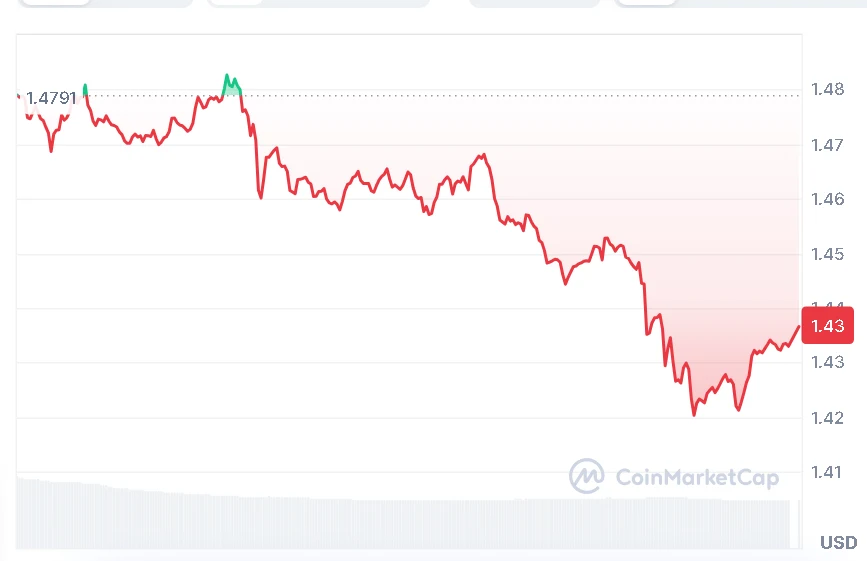
Source: CoinMarketCap
Also Read | XRP Price Analysis: Can XRP Reclaim $1.49 Resistance?
XRP Price Tests Key Support
As reported by crypto analyst More Crypto Online on May 12, 2026, the present movement of the XRP price is still trading within the larger sideways pattern. The recent fall from its highs reached on May 10 is interpreted as just a corrective move and not a trend reversal. From a wave structure point of view, this is creating a perfect 3-wave down.
A key level for the XRP price to be monitored is the swing support zone at $1.38. With the retention of this level, the whole pattern leaves an option for one more impulse to develop. In case the buyers keep defending this zone, the rate may try to develop a bullish diagonal pattern.
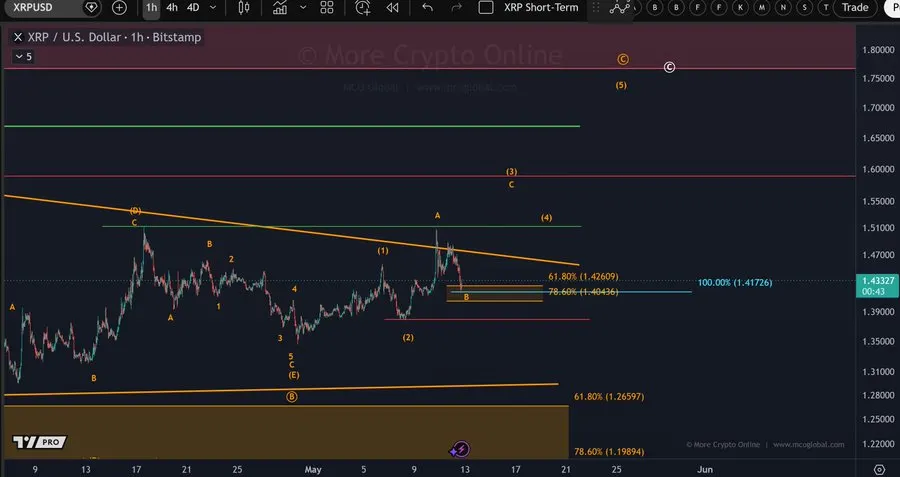
Source: More Crypto Online’s X Post
Meanwhile, upside potential is still relatively weak at the moment. This uptrend, starting from the low on April 5, is likely corrective as well. In the near future, the immediate support level for XRP lies in the range of $1.40-$1.42.
This range can be viewed as an interesting short-term support area, but it should not be considered relatively strong because, in the case of corrective waves, the response in relation to these areas tends to be rather imbalanced. Indeed, the internal support at $1.41 was already hit.
XRP Momentum Indicators Show Gradual Recovery
Despite the recent bearish sentiments on the price of XRP, the indicators are now showing a gradual improvement. The Relative Strength Index (RSI) is trading at 53.92 and is now above its signal line, which is at 52.15. This is an indication that buyers’ activities are gradually increasing following the sideways trading range.
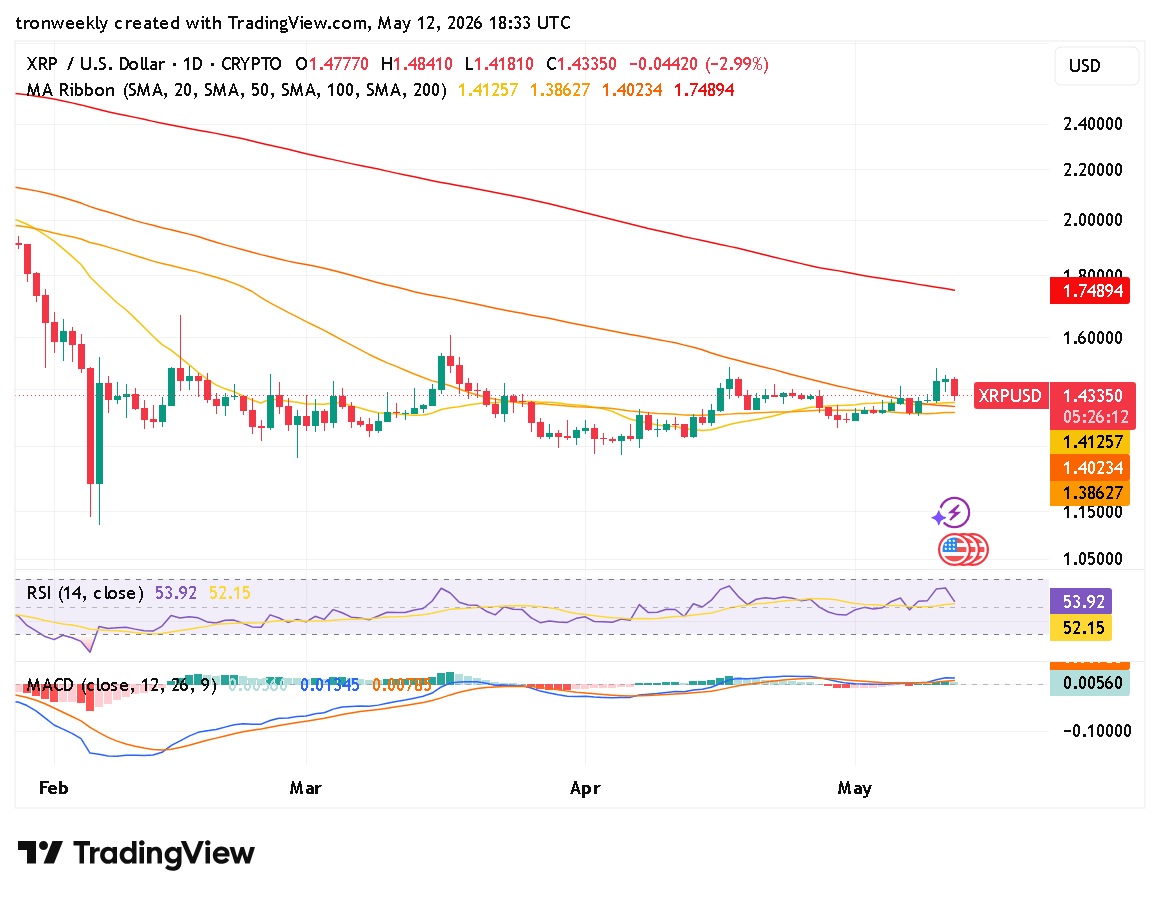
Source: TradingView
MACD is also becoming bullish. The MACD line is currently trading higher than the signal line at 0.00785 with 0.01345. Green histogram bars are starting to emerge after a long period of time. This means that momentum behind the price of XRP is gradually building, but not quite enough for a breakout yet.
Outlook for XRP Price
Overall, the XRP price is currently in a consolidation period, where both correction and uptrend signals exist. Given that the price stays above the $1.38 level, there is still some potential for the price to attempt an upside rally again.
What comes next in the XRP price will be determined by how much strength the buyers can create to turn the correction into an uptrend.
This article contains market analysis and price predictions. These are not guarantees. Crypto markets are volatile. Always DYOR. Not financial advice.
Also Read | CLARITY Act’s 309-Page Crypto Market Overhaul