FLOKI (FLOKI) shows mixed momentum, remaining stable over the past 24 hours while recording a 4.84% weekly decline as of 1 May 2026.
According to CoinMarketCap data, the token trades at $0.00003206. The 24-hour trading volume is $27.15 million, reflecting a 39.07% daily drop.
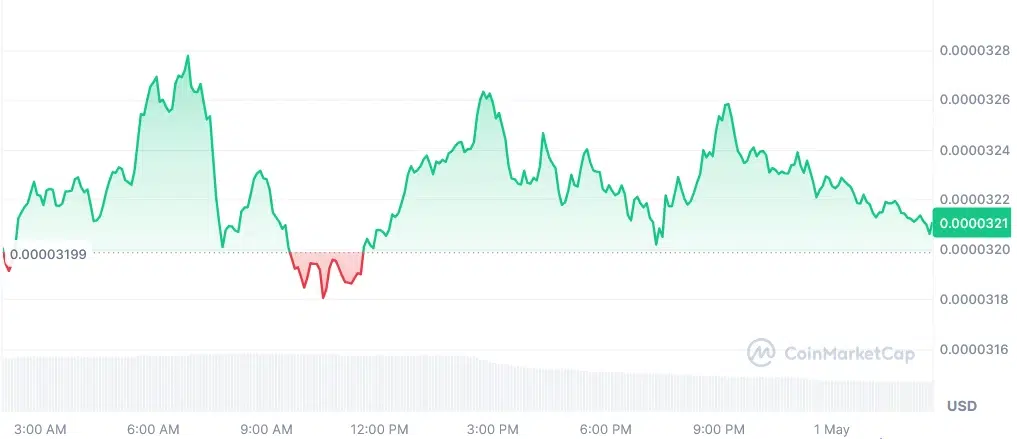
Meanwhile, market capitalization stands at $305.75 million, remaining stable over the same period as momentum builds steadily.
Also Read: FLOKI Price Surges as Bullish Momentum Builds Toward $0.000075 Target
Price Structure Signals Accumulation Phase
The price action shows a prolonged downtrend transitioning into a basing structure, with buyers defending the $0.000025–$0.000026 demand zone.
The recent higher lows signal early accumulation. However, momentum remains constrained beneath $0.000038–$0.000040 resistance, making this a critical decision area rather than a confirmed bullish continuation for now overall.
According to the crypto analyst Crypto Tony, a bullish scenario requires a decisive breakout and daily close above $0.000040, followed by a successful retest.
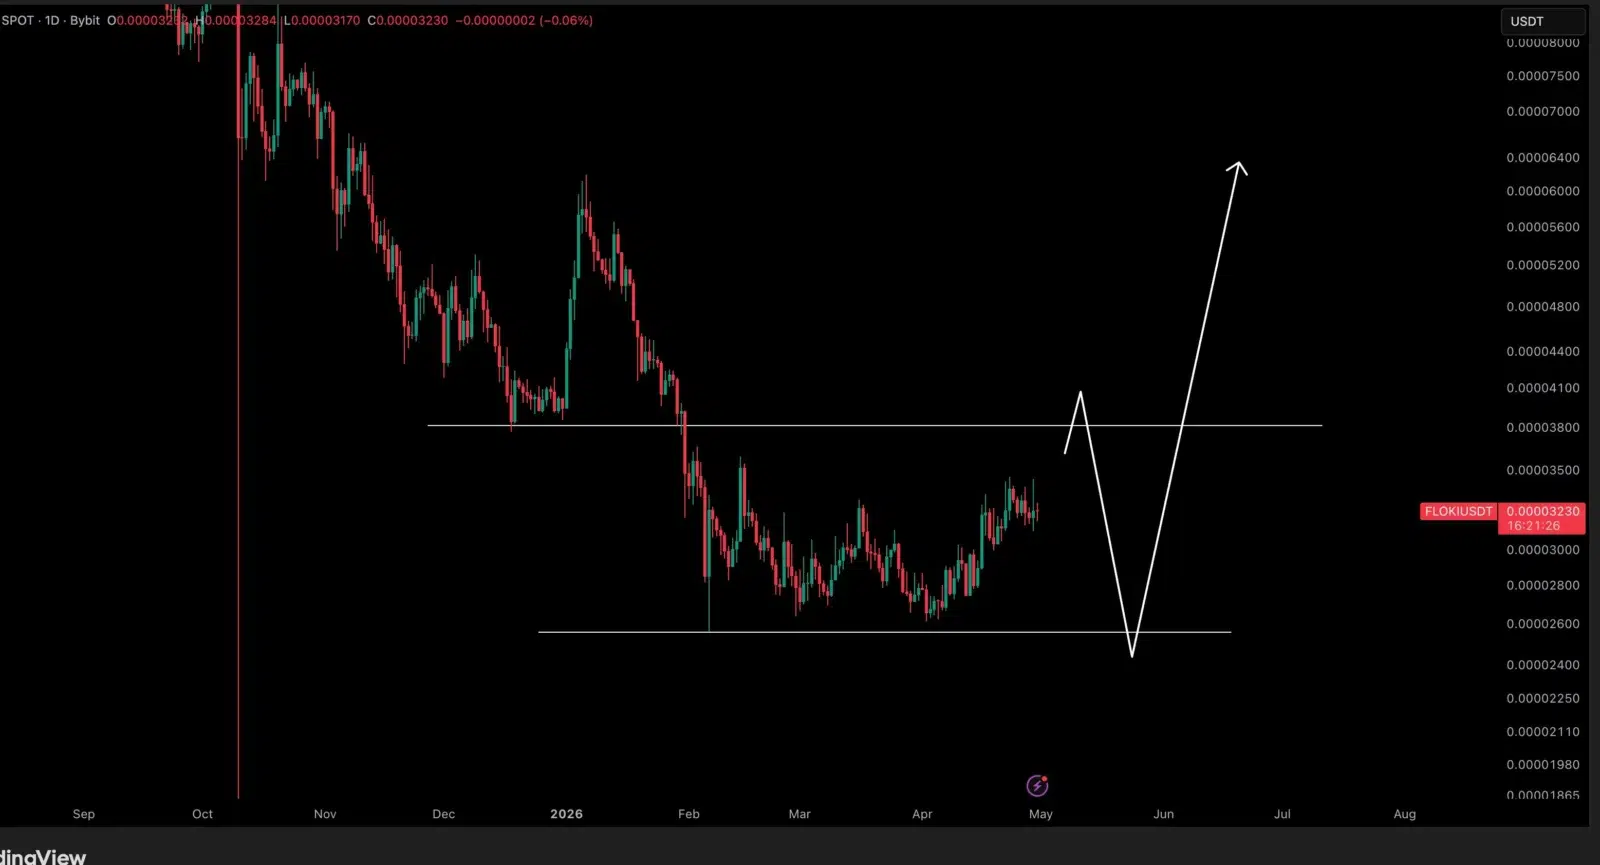
It could be expected that the targets would head towards $0.000048, followed by $0.000055, $0.000065, and even $0.000075. The combination of a good rally in momentum and increasing volume should cement the trend, leading to greater barriers ahead.
In case of failure in acceptance of the offer, prices may fall to $0.000030, sweeping liquidity to the support level of $0.000026.
The violation of this base level will bring prices to target levels of $0.000022 and $0.000020. Such an event will invalidate this bullish bias pattern, indicating further declines in the trend.
Indicators Show Weak but Positive Bias
Momentum indicators reflect cautious optimism without strong confirmation. The Relative Strength Index (RSI) is hovering around 55.18, while the signal is at around 58.06.
This indicates moderate bullish sentiment without being overbought since the index is not more than 70. This means that there are buyers in the market, but they are not taking control.
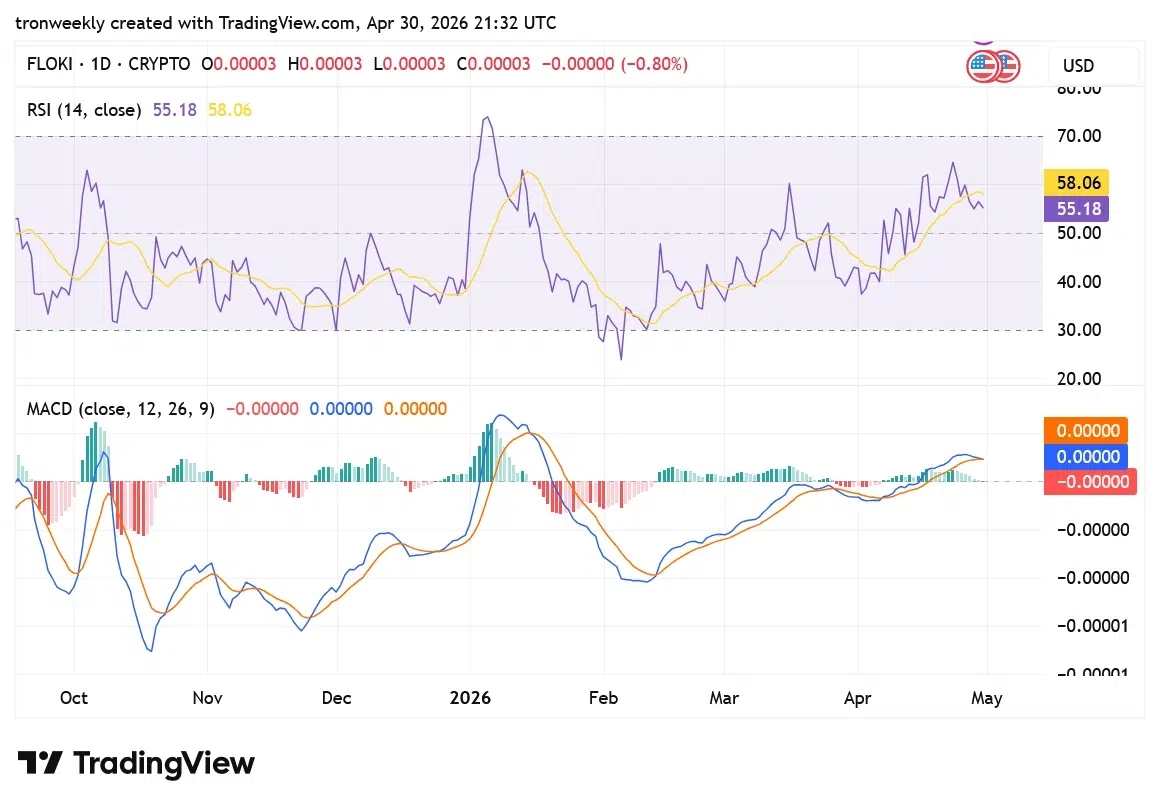
MACD lines are approaching each other around the zero level, with the MACD line being above the signal line, and the histogram moving towards a horizontal shape.
This shows that bearish momentum is weakening while the bullish crossover continues, although there is no strong momentum for now.
This article contains market analysis and price predictions. These are not guarantees. Crypto markets are volatile. Always DYOR. Not financial advice.
Also Read: FLOKI Gains Momentum With 45% Volume Spike Eyeing $0.00010 Level