
As of May 14, 2026, ADA price analysis shows that the token is facing a critical support test after a fresh SuperTrend buy signal appeared on the daily chart. Analysts remained divided as ADA trades lower, while market data shows higher volume and weaker open positioning across derivatives.
As of writing, Cardano (ADA) is trading at $0.2647, showing a decline of 3.14% in the past day. The trading volume is up by 6.91% and is currently standing at $490.91 million. Over the last week, the coin price has gone down by 1.22%, according to CoinMarketCap.

Also Read: XRP ETF Signals Strong Accumulation As Volume Hits $12 Million
ADA Price Analysis Shows SuperTrend Buy Signal
Crypto analyst Ali Martinez pointed out that Cardano might be gearing up for another bullish move. The SuperTrend indicator is his most reliable tool for identifying long-term trend shifts of Cardano.
The indicator had a sell signal on September 25, 2025, said Martinez. This signal preceded a 73% price drop in ADA.
The indicator has now shifted from a correction mode to a buy mode after a few months of correction on the daily chart of Cardano. In this ADA price analysis, Martinez notes that the move was driven by possible local exhaustion and a potential trend reversal.
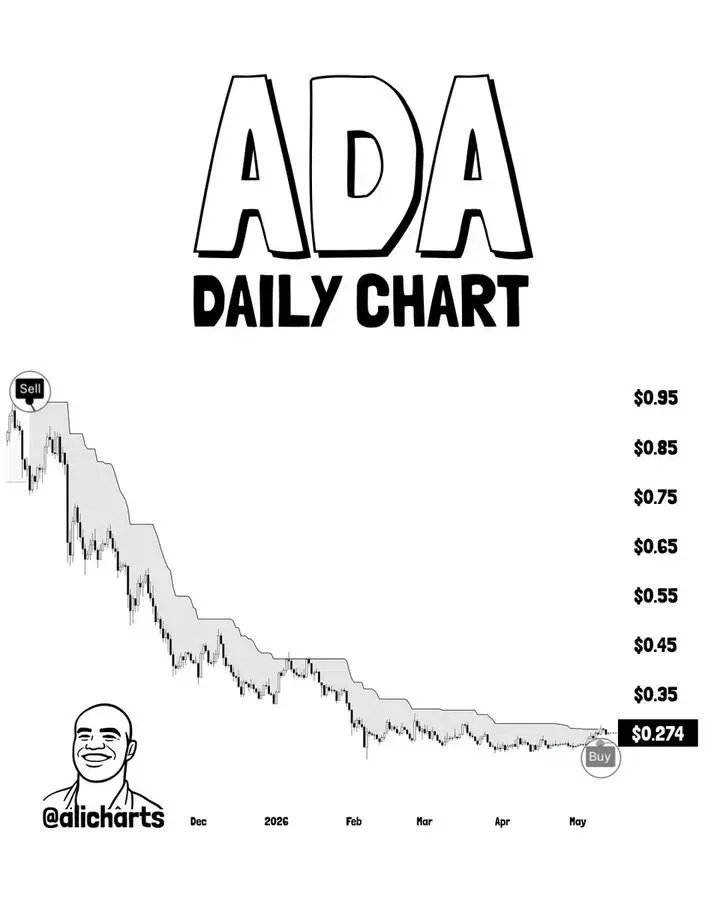
He has set the initial upside resistance at the $0.33 level. If momentum continues, he said ADA could later target $0.42, while the bullish setup depends on the $0.25 support level holding.
A move below $0.25 would put the recovery view on hold. This is significant as ADA continues to hold its ground near the short-term support level following a recent daily drop.
ADA Upside Looks Corrective as Support Is Tested
Moreover, another analyst, More Crypto Online, gave a more cautious outlook. He revealed that ADA’s run upside indicates that its current trend is still corrective and not impulsive, providing a potential setting for a local top to appear at any moment.
The analyst noted that there is still some selling pressure in the market, as evidenced by the lack of upward momentum. This ADA price analysis is looking at the initial internal micro support zone between $0.25 and $0.26, which is currently being tested.
As long as this range holds, ADA could still attempt another fifth wave higher. The analyst added that the upward scenario is still possible near $0.30 in the next level.
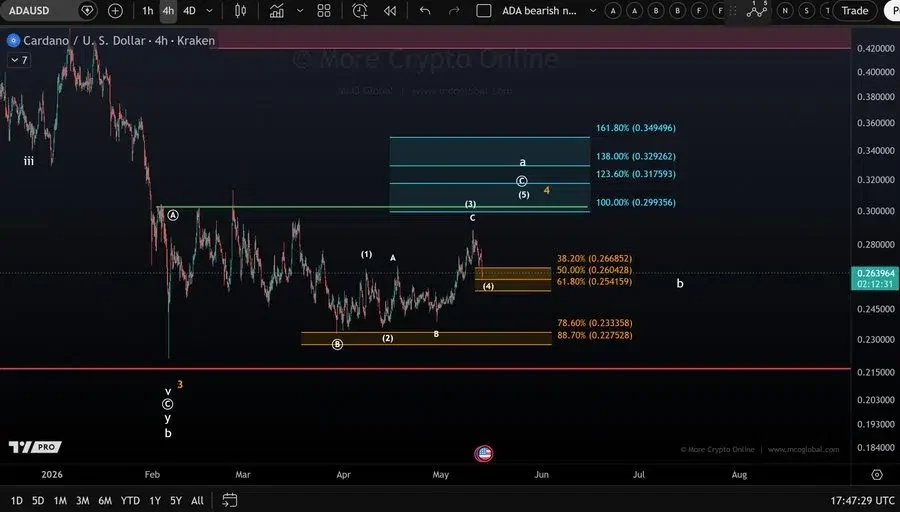
A pullback breakout below the top band would bring focus back to the bottom support area of $0.227 – $0.233. This ADA price analysis reveals that the structure is still fragile, even when there is a possibility that it will still try to move higher.
Volume Rises as Open Interest Falls
According to CoinGlass data, the future volume grew by 6.62% to $646.86 million. Open interest fell 3.22% to $546.63 million. The OI-weighted funding rate stood at 0.0068%, showing higher activity but fewer active positions.

The data suggests increased trading volumes and fewer open positions. This ADA price analysis shows Cardano remains between a bullish indicator signal and fragile support conditions.
Also Read: SUI Price Breakout Holds: Bulls Eye $4.20 Target After Pullback Signal