
ApeCoin (APE) saw a sharp rally followed by consolidation after volatility, with improving momentum for the APE price, testing a key resistance zone while remaining below long-term trend indicators.
Trading activity strengthened significantly, reflecting higher participation, better liquidity, and growing market interest alongside cautious sentiment. According to CoinMarketCap, APE is trading at $0.1554 with signs of stability over the last 24 hours.
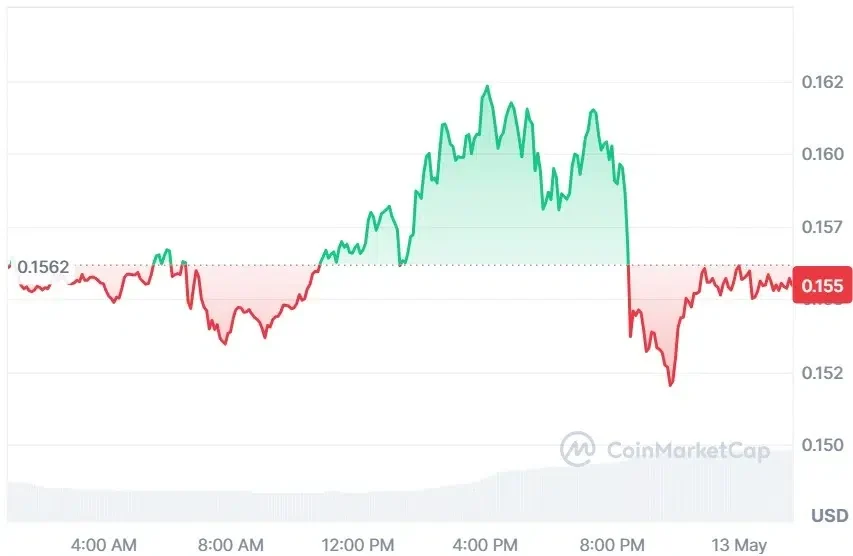
Source: CoinMarketCap
APE Derivative Data Point to Increasing Strength
According to Coinglass, the APE open interest increased by 3.48%, reaching $64.96 million, indicating a moderate rise in outstanding derivative contracts. This reflects steady participation from traders, suggesting cautious optimism and continued capital inflow into the market.
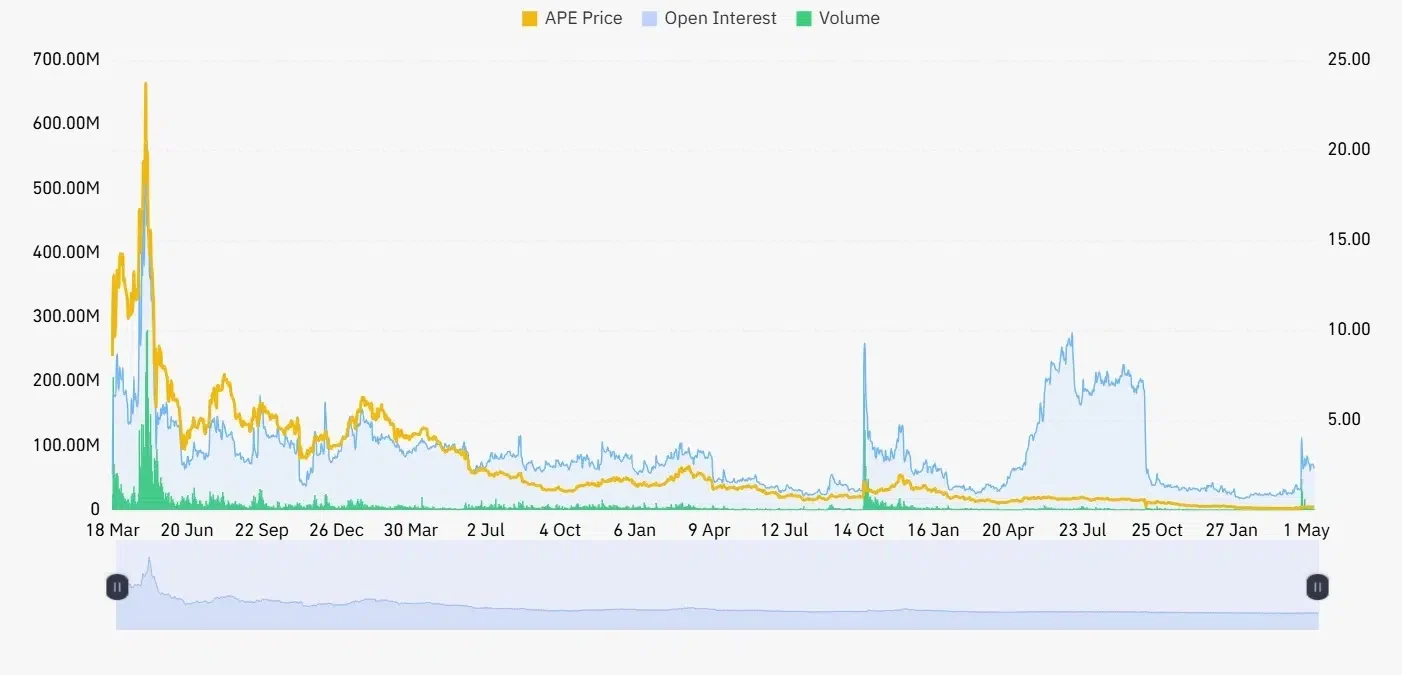
Source: Coinglass
However, volume increased by 56.03%, reaching $108.63 million, indicating strong trading activity and higher market participation. This suggests growing momentum and improved liquidity conditions, reflecting increased investor interest and bullish sentiment across the broader market.
Also Read: ApeCoin (APE) Approaches Critical Support: Is a Reversal to $5.90 on the Horizon?
APE Price Setup Hints at Strong Upside Move
Furthermore, the crypto analyst Jonathan Carter revealed that the APE price is approaching an important technical battleground on the weekly chart as the token approaches the midpoint of a long-term downward trend.
The momentum has started increasing again following a prolonged period of correction, with buyers making higher lows. Structure is tightening, indicating that a breakout or a breakdown could occur soon.
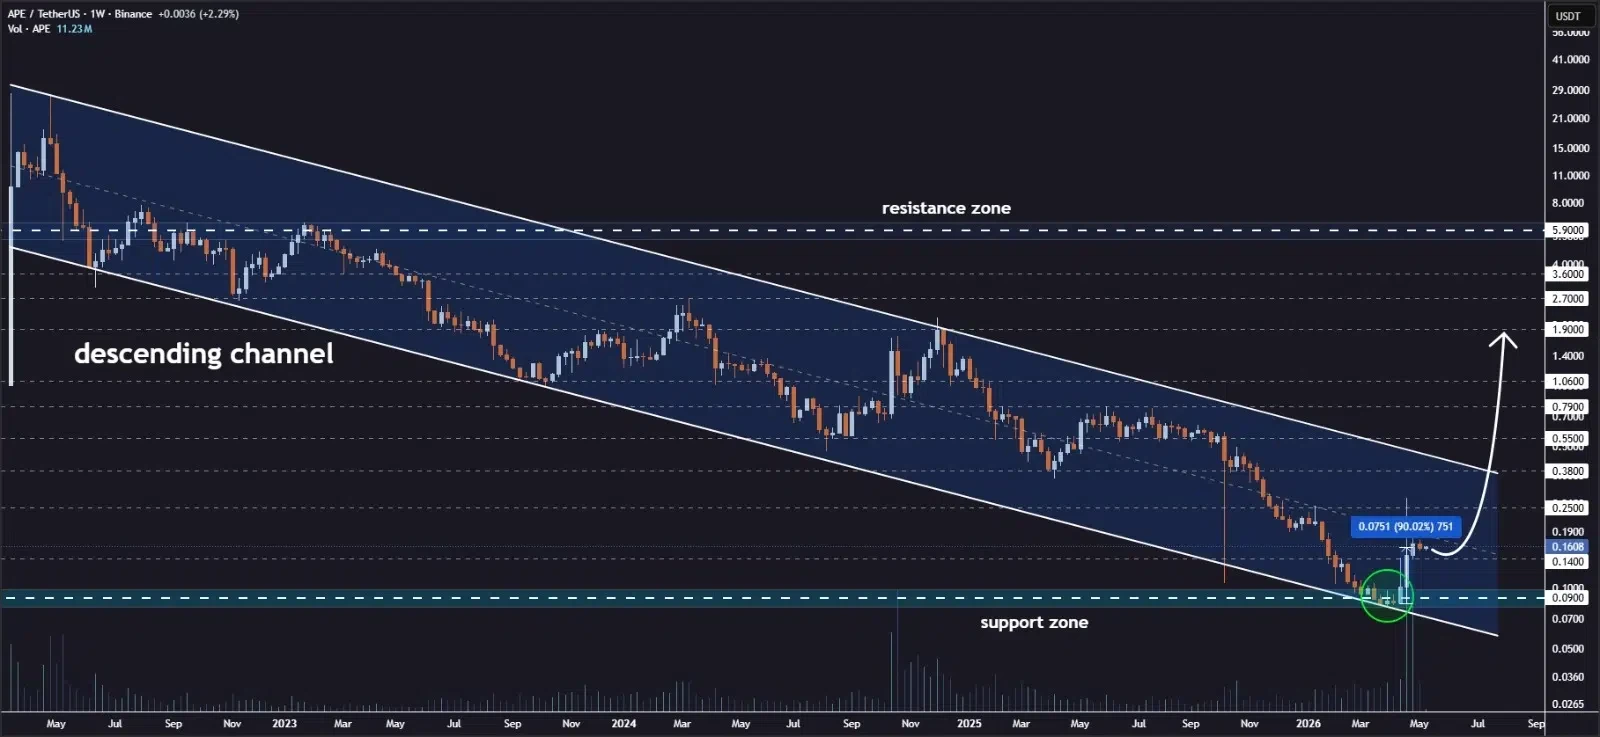
Source: Jonathan Carter’s X Post
In case of continued bullish pressure, the technical analysts will keep their focus on the resistance levels of $0.25, $0.38, $0.55, $0.79, $1.06, and $1.90.
A move beyond the midpoint of the channel can signal a change in the existing trend, whereas failure to move past higher prices can see the continuation of the consolidation phase.
Technical Indicators Point to Short-Term Consolidation
According to TradingView, the APE price movement has gone from a bearish trend to one with explosive volatility. Between February and March, prices continued to move downwards and remained below their major EMAs.
The APE price then skyrocketed at the end of April, reaching 0.27000. This caused the Bollinger Bands to be stretched, implying a huge increase in trading volume.
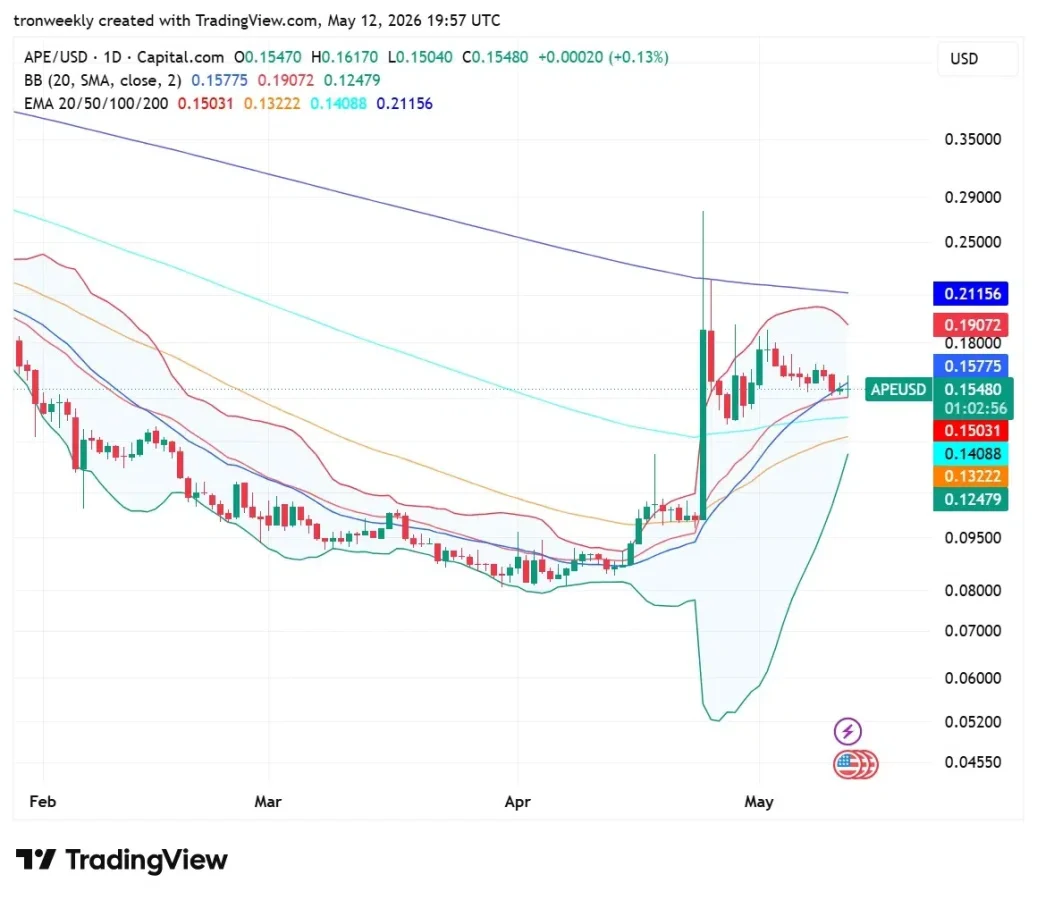
Source: TradingView
Following the breakout, the APE price begins to flatten. The price finds support at the level of 0.15480 through the 20-day moving average line.
Since the APE price is yet to cross the 200-day exponential moving average line, it can be noted that the narrowing Bollinger Bands point to the market’s rest period.
This article contains market analysis and price predictions. These are not guarantees. Crypto markets are volatile. Always DYOR. Not financial advice.
Also Read: ApeCoin Downtrend Exhaustion Builds Case For $0.55