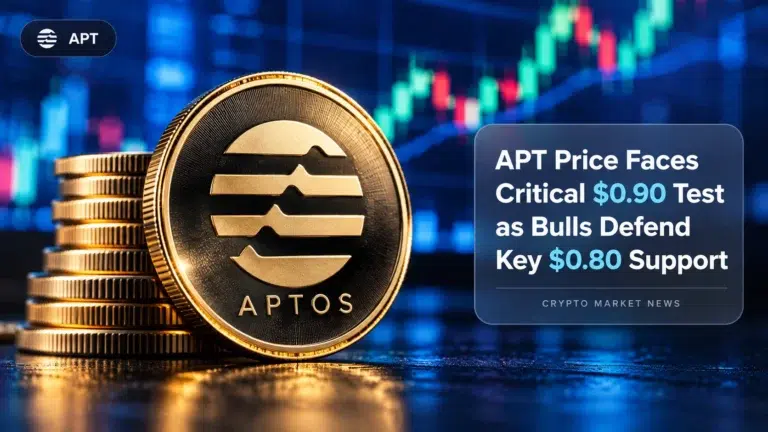
The APT price on Tuesday, September 29, 2026, continued to be under scrutiny, with traders watching a significant technical setup, robust derivatives interest, and the growth of Aptos’ cross-border stablecoin settlement service in global markets.
Table of Contents
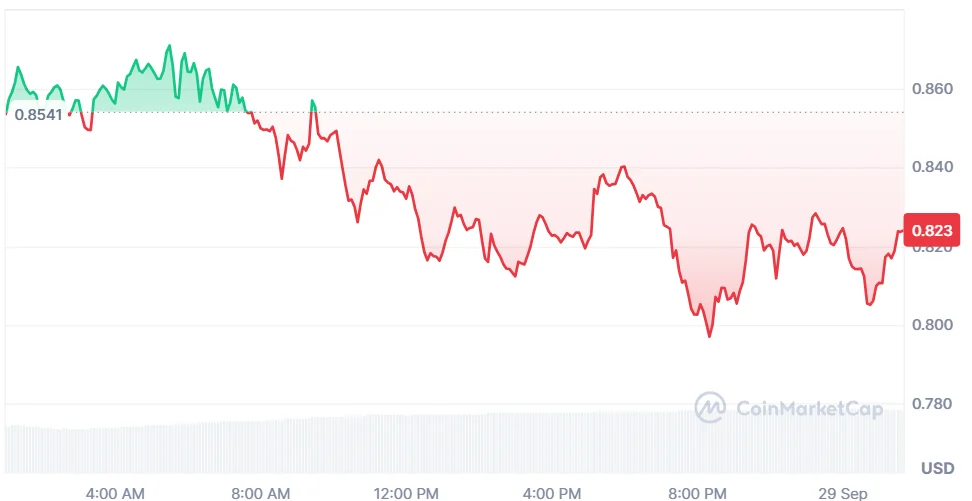
As of writing, Aptos (APT) is trading at $0.8224, showing a decline of 4.45% in the past day. Trading volume increased 34.47% to $96.28 million, indicating stronger market activity. Over the last week, the coin price has increased by 6.3%, according to CoinMarketCap.
Also Read: Chainlink CCIP 2.0 Cuts Ethereum Confirmation Times to Seconds
Why APT Price Faces a Critical Test Near $0.90 Resistance
Analyst Crypto With Gopal highlighted that APT is forming a rising wedge consolidation pattern as prices move closer to the $0.90 resistance zone.
The consolidation pattern suggests that bulls continue pushing markets upwards but show signs of weakening momentum at the level of resistance.
For bulls to sustain the bullish technical setup, buyers will need to hold the $0.80 support zone, currently a critical level of the rising wedge pattern.
According to the analyst, any confirmed breakdown below the $0.80 support zone threatens to unravel the present pattern and exposes markets to an extended correction to $0.55.
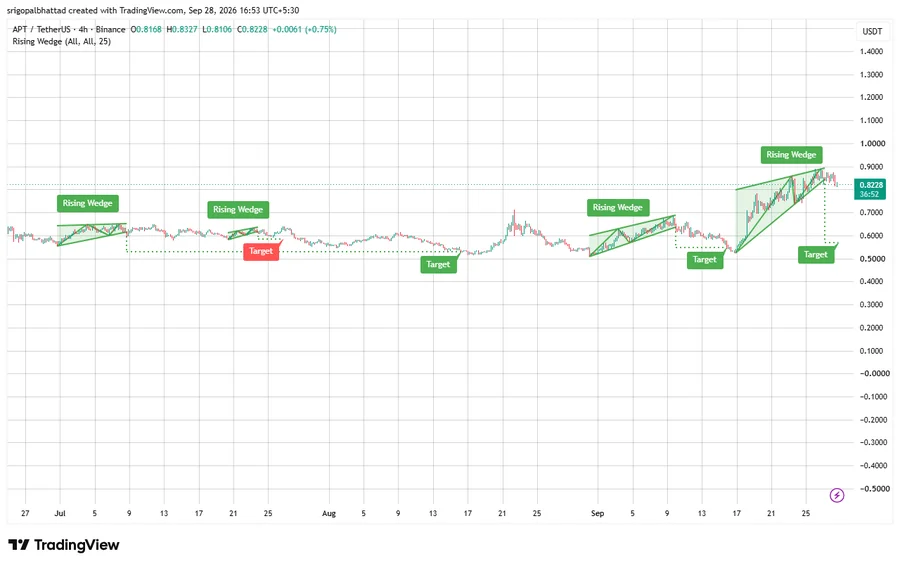
On the other hand, a successful break above the $0.90 resistance zone invalidates bearish implications of the rising wedge consolidation and opens up scope for further gains.
Markets are now poised at a crucial technical juncture of the rising wedge pattern. Traders await decisive action around these two critical technical thresholds of $0.80 and $0.90.
How APT’s Wave Structure Could Shape the Next Price Move
Moreover, another analyst, More Crypto Online, mentioned that APT needs to defend the $0.57-$0.71 support range in the upcoming retracement period to sustain its bullish upside momentum.
The analyst describes the recovery phase as an ABC correction pattern, indicating an incomplete uptrend development phase. The significance of this support range lies in testing whether the bullish setup will persist.

The analyst further explained that a five-wave upward trend will add a technical outlook to the rally and prove more sustainable bullish momentum, improving the credibility of the recovery phase.
Until then, the $0.57-$0.71 support range serves as the primary focus zone in all potential retracements.
What Rising Derivatives Activity Signals for APT Price
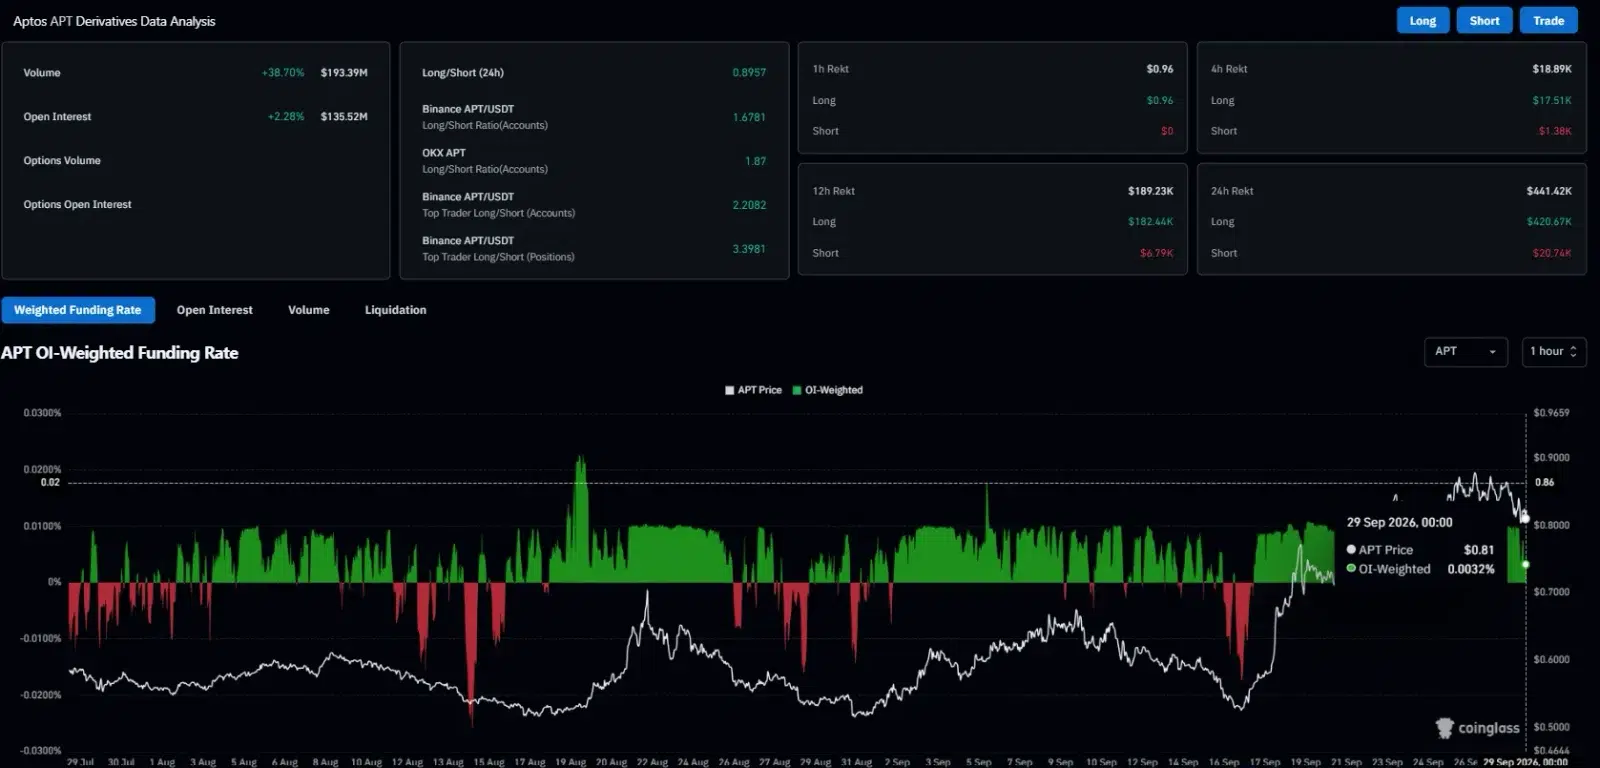
According to CoinGlass data, futures volume registered a 38.70% gain to $193.39 million, indicative of greater levels of market engagement. Open interest grew by 2.28% to $135.52 million, implying a modest increase in derivative positions.
Meanwhile, the APT OI-weighted funding rate stands at 0.0032%, suggesting slightly positive positioning among leveraged traders.
According to CoinGlass liquidation heatmap data, APT is currently trading close to $0.82 following its recovery above the $0.80 zone. An upward liquidation cluster ranging from $0.84 to $0.85 represents a critical liquidity level for traders.
Further liquidation clusters range between $0.86 and $0.87, as well as $0.89 and $0.90. These levels will attract price if bullish momentum strengthens.
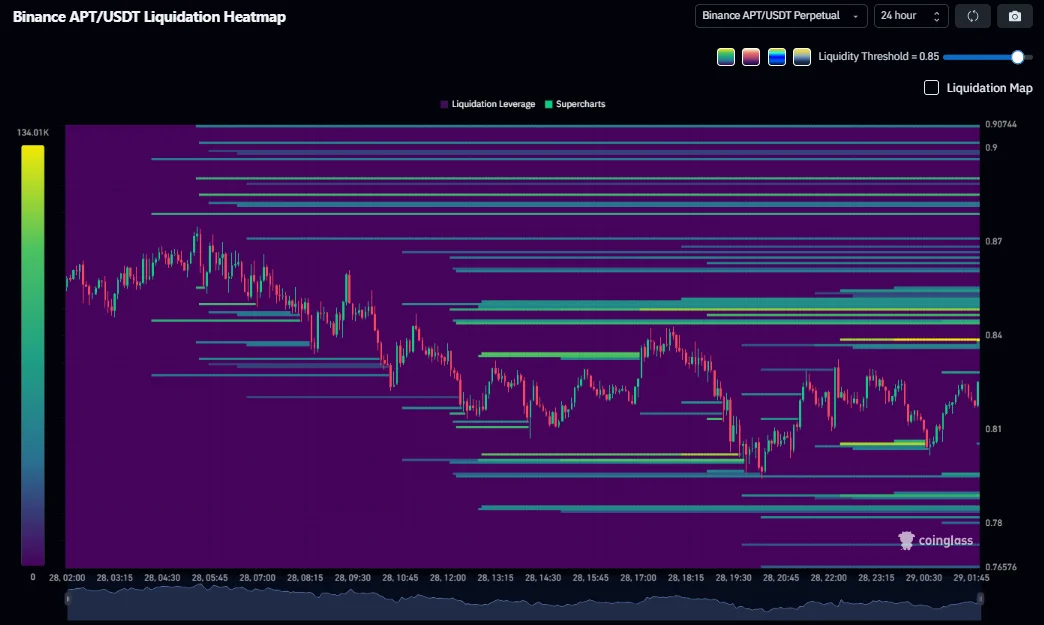
For bears, significant liquidity resides in the zones of $0.80-$0.81, followed by $0.79 and $0.78. A drop below the level of $0.80 would place downward price action under additional liquidation risks.
Holding above $0.81 maintains stability within the immediate timeframe, whereas an upside breakout above $0.85 opens a potential route towards the more elevated liquidity areas.
How EMA Structure Supports Short-Term Momentum
According to TradingView data, Aptos currently trades at $0.8300 above several key Exponential Moving Average (EMA) levels. The 20-day EMA is placed at $0.7386, whereas the 50-day EMA sits at $0.6692, illustrating relatively robust near-term upward momentum.
The 100-day EMA is positioned at $0.6801, still below the current APT price level. Conversely, the 200-day EMA registers higher at $0.9242 and represents significant long-term resistance. Should $0.9242 breach, it would fortify the overall technical structure.
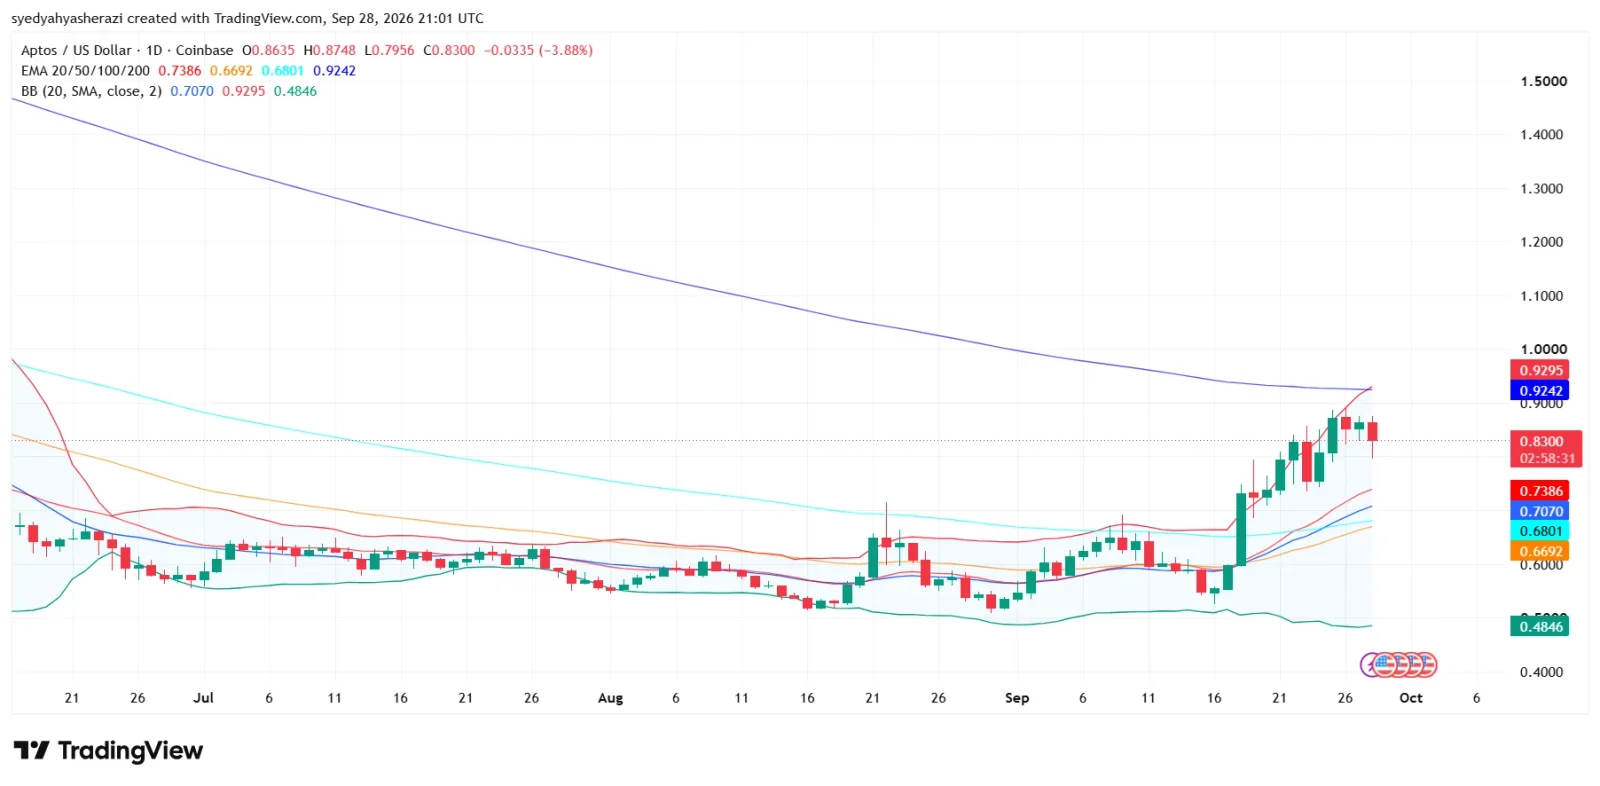
The Bollinger Bands (BB) indicator places the middle line at $0.7070, the upper line at $0.9295, and the lower line at $0.4846. APT trades above the middle band but remains below the upper range.
This positioning indicates positive momentum while keeping the $0.9295 region as a major resistance zone.
Why Aptos Is Emerging as a Cross-Border Settlement Layer
In a post on X, Aptos announced support for the development of a regulated payment corridor between enterprises in Nigeria and the UAE through stablecoin payments.
Under this arrangement, a Nigerian enterprise makes payment using its domestic currency while a UAE enterprise receives payment using its domestic currency, facilitating stablecoin transfers across the Aptos blockchain infrastructure as the underlying settlement layer.
Daya and HashKey MENA are partnering to develop this corridor, facilitated by Aptos Foundation backing.
This effort marks a critical milestone for Aptos, expanding its practical applications in payments in Africa and the Middle East adding, a fundamental adoption angle alongside the current APT price setup.
Also Read: Ethereum Holdings Top 6 Million as BitMine Stakes 5.07M ETH
This article contains market analysis and price predictions. These are not guarantees. Crypto markets are volatile. Always DYOR. Not financial advice.