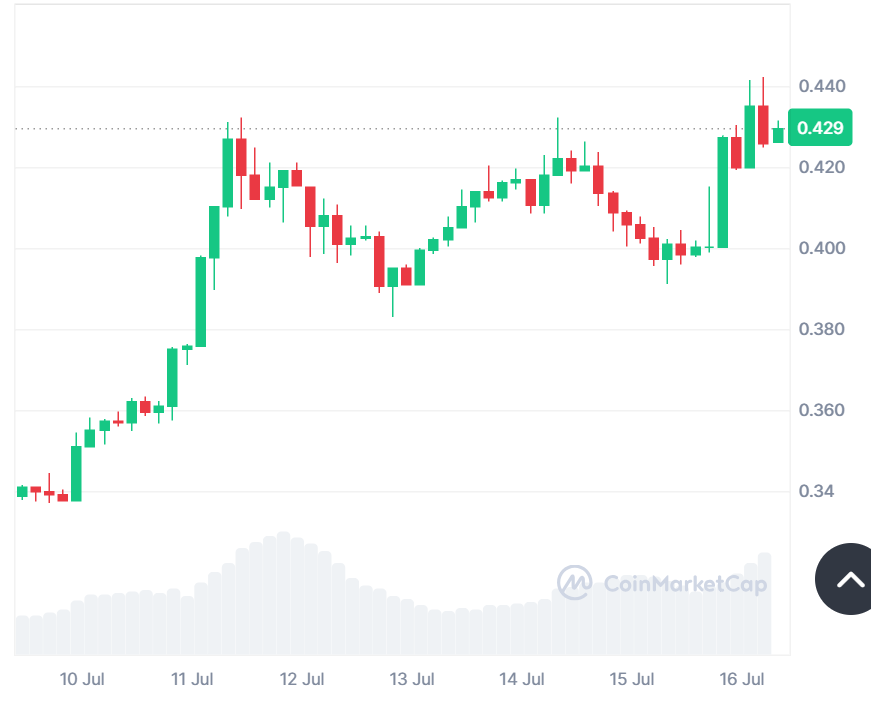
- Arbitrum (ARB) surged 8.48% in a day, with trading volume rising 31.87% to $496.57 million.
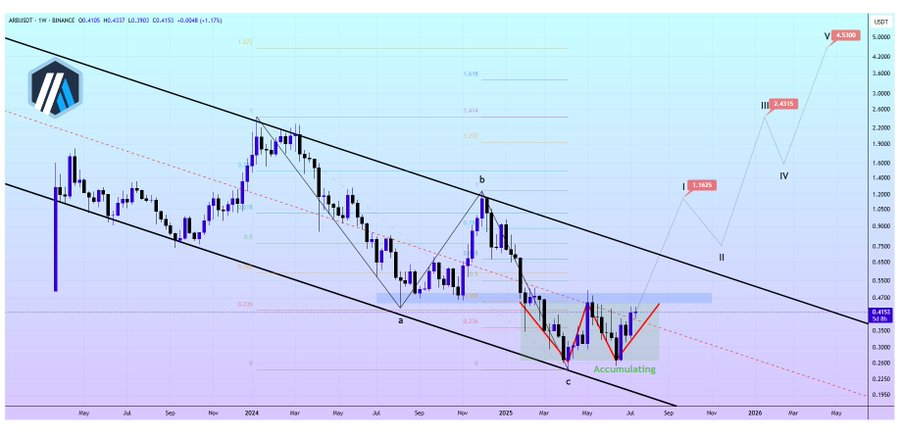
- Analyst Alex Clay sees ARB’s W-Bottom pattern as a buy signal, predicting a rally with targets of $1.1625 and $4.5300.
- MACD data shows bullish momentum for ARB, with a positive Histogram indicating continued upward strength.
Arbitrum (ARB) is trading at $0.42, marking an 8.48% increase over the past day. The trading volume of the coin also increased by 31.87% to reach $496.57 million. Over the last week, ARB has risen by 27.38%. Such a good performance is also evidence of the investor confidence and a good future for the coin.
Source: CoinMarketCap
Analyst Alex Clay highlighted that ARB is through its ABC correction cycle. He observes that ARB has started to develop a W-Bottom pattern which is an indication of accumulation. Clay feels that this is a good opportunity to purchase at a cheaper rate and expects a rally in the short run. His intermediate targets of ARB are $1.1625, $2.4315 and a long-term target of $4.5300.
Source: X
Also Read: Arbitrum Jumps After Robinhood Listing; Is $0.50 Next or Will ARB Drop Further?
Bullish Momentum Building
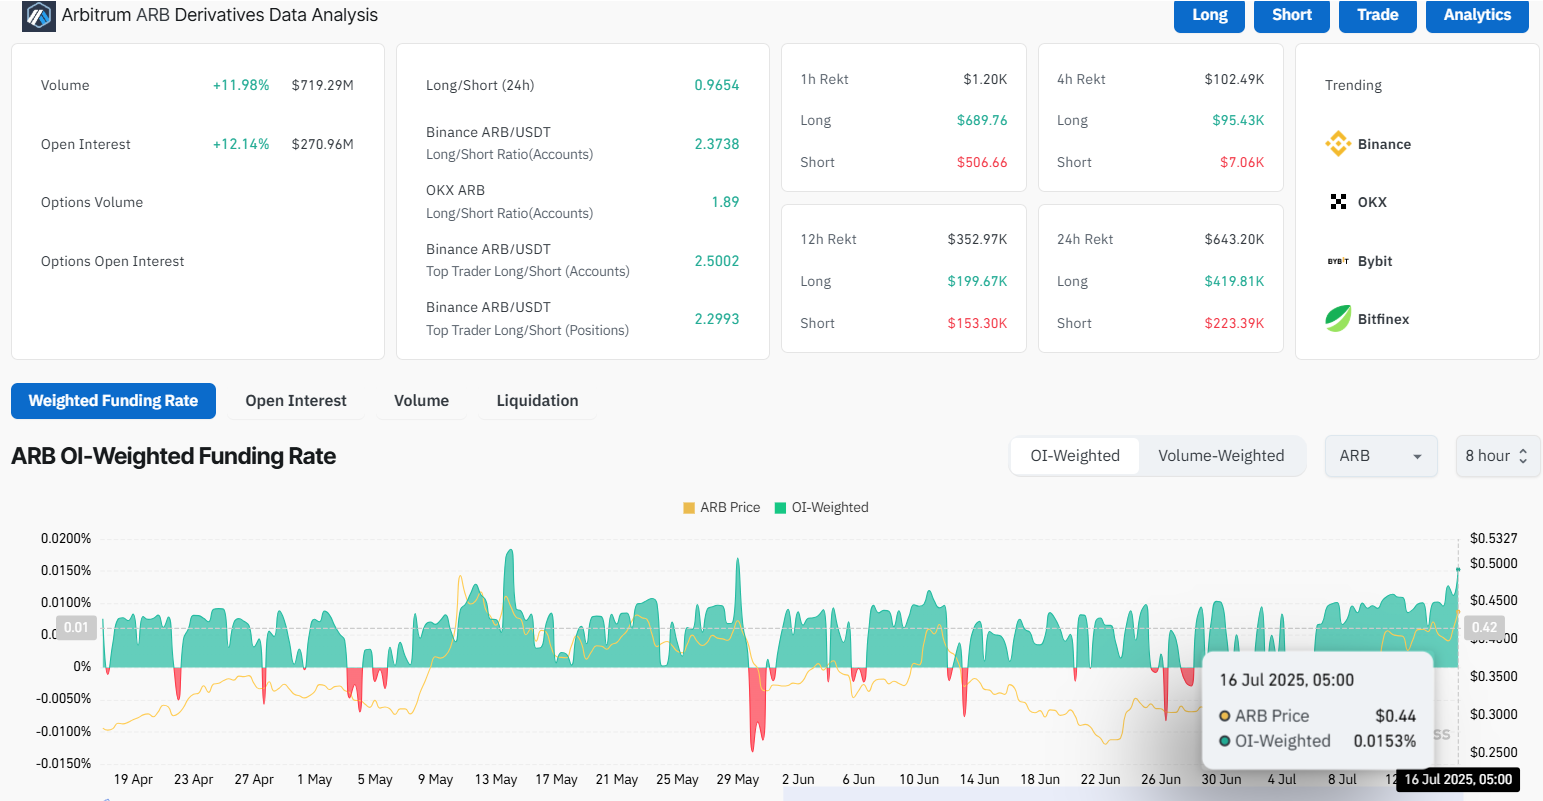
According to CoinGlass data, the volume rose by 11.98% to $719.29 million. The open interest also increased by 12.14% to $270.96 million. The ARB OI-weighted funding rate is 0.0153%. These figures show a robust market participation and investor confidence.
Source: CoinGlass
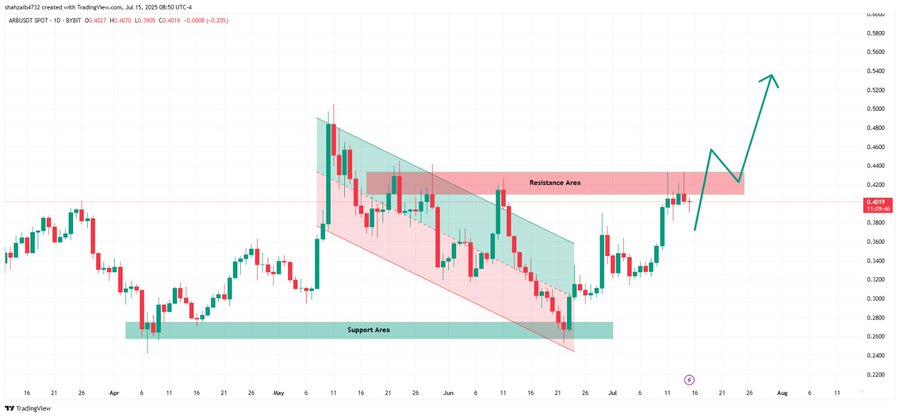
FOUR Crypto Spaces revealed that ARB is gaining bullish strength. The daily chart reveals that ARB has escaped its downtrend and is converging towards an important resistance level. Should ARB turn this level into support, then it is possible that a bigger rally occurs. This is a very critical technical shift and traders are waiting to see confirmation.
Source: X
Arbitrum MACD Signals Momentum
The Relative Strength Index (RSI) of ARB is at 65.66, nearing an overbought area. This indicates a good bullish market, which might take a small correction. Nonetheless, the bullish RSI reaffirms that the coin still exhibits bullish trends and has greater bullish potential so long as market conditions remain supportive.
MACD (Moving Average Convergence Divergence) data for Arbitrum (ARB) indicates that the MACD line is 0.0098, the Signal line is 0.0237, and the Histogram value is 0.0139. The bullish Histogram signifies a positive upward momentum and therefore ARB can be expected to be bullish.
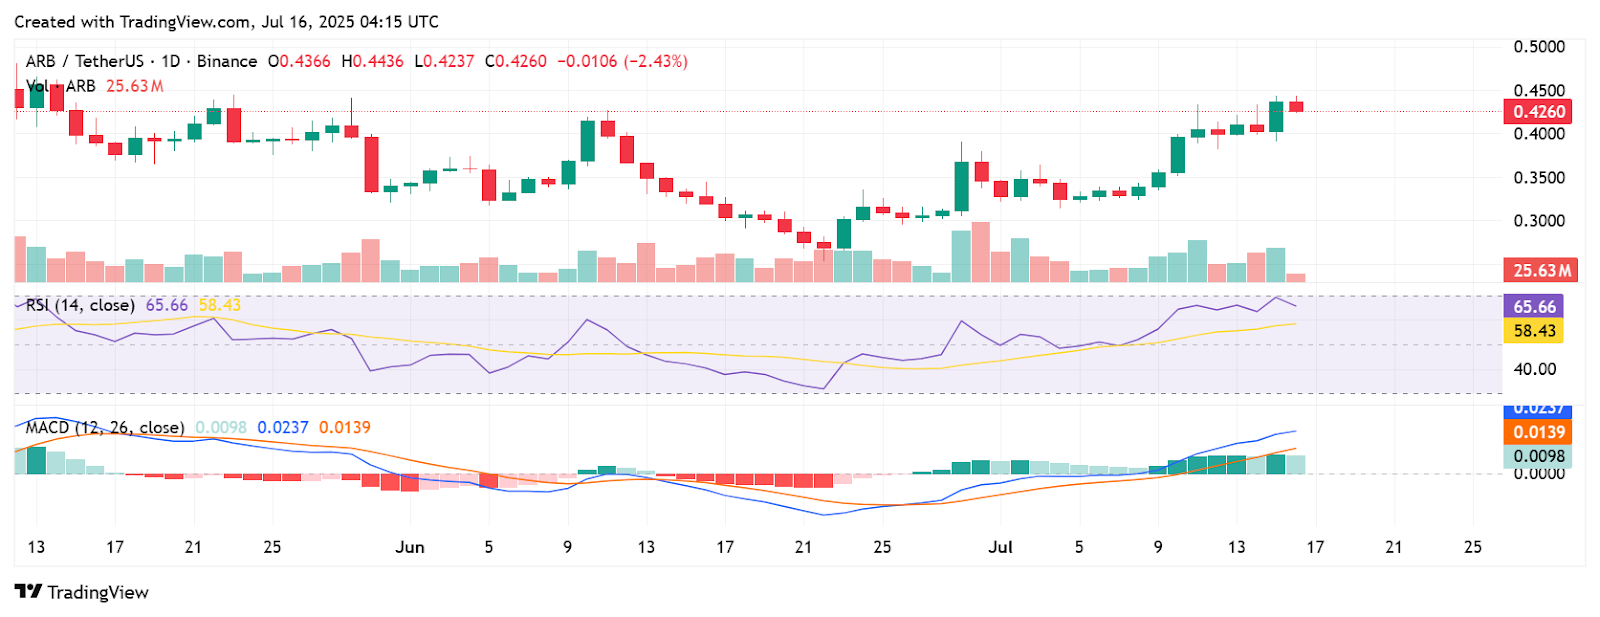
Source: TradingView
Arbitrum will continue its growth. Technical indicators are also strong, volume is building and sentiment is positive, all pointing towards future upward potential. The next few days will be decisive in deciding the further movement of the rally as the ARB tests the crucial resistance levels.
Also Read: Arbitrum (ARB) Gains Speed Targeting Key $0.50 Resistance
Disclaimer: This article is based on real-time market data and general technical observations. It does not constitute financial advice. Always conduct your own research before making investment decisions.