Binance Coin’s surge on the cryptocurrency charts was reflective of the performance exhibited by the rest of the market. BNB was one of the highest gainers in the last 7 days, beaten out by only Dogecoin from the top 10 club. A 9 percent surge in the past 24-hours allowed its market cap to cross the $48 billion mark.
The growth in the last 24 hours also elevated the trading volume to a whopping $48.12 billion, $3 billion more than Cardano. According to the analysis, the cryptocurrency has followed Bitcoin’s movement into greener lands. The world’s largest cryptocurrency as making waves on its own after settling above the $36,000 mark for the first time in more than 10 days.
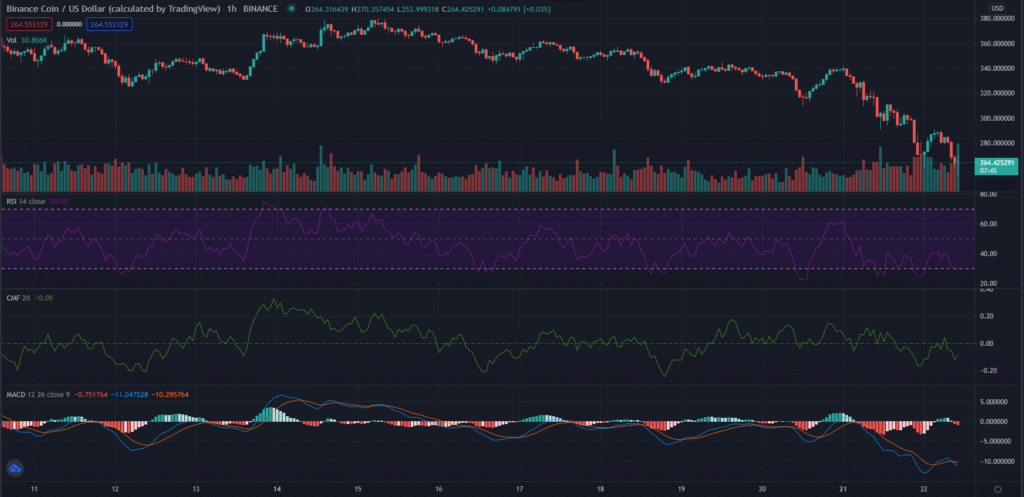
BNB 1 hour:
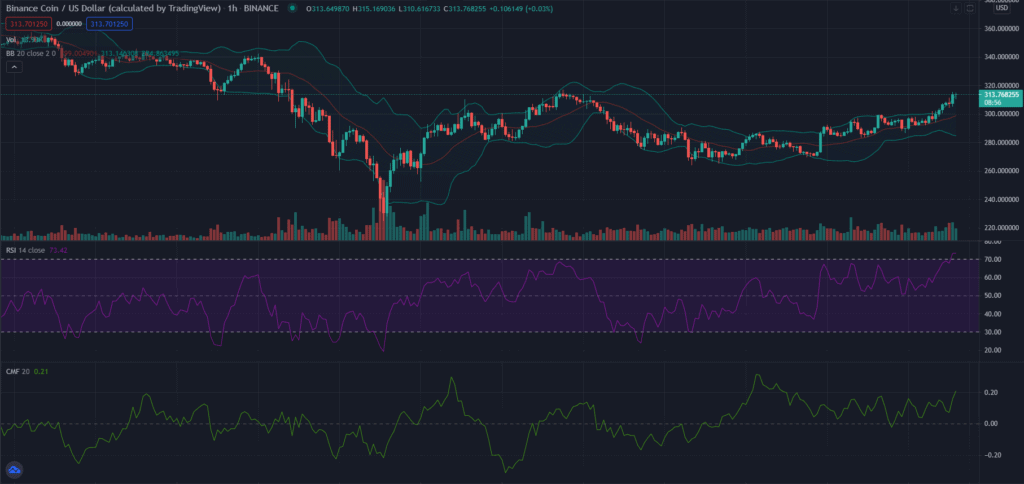
BNB’s hourly chart showed a striking growth in the near future as shown by the open maw of the Bollinger bands. The bear’s arrival was also signaled by the candles breaking out from their previous red price action. At press time, BNB had equaled its immediate resistance of $213 and was well on its way to break it.
The RSI’s surging climb in the overbought zone was proof enough of BNB’s growing appeal in a bull market. As more users buy into the BNB ecosystem, the RSI will continue to remain in the buy-in zone. With the arrival of more investors, the capital coming into the ecosystem has naturally gone up. This was indicated by the Chaikin Money Flow on the hourly spectrum.
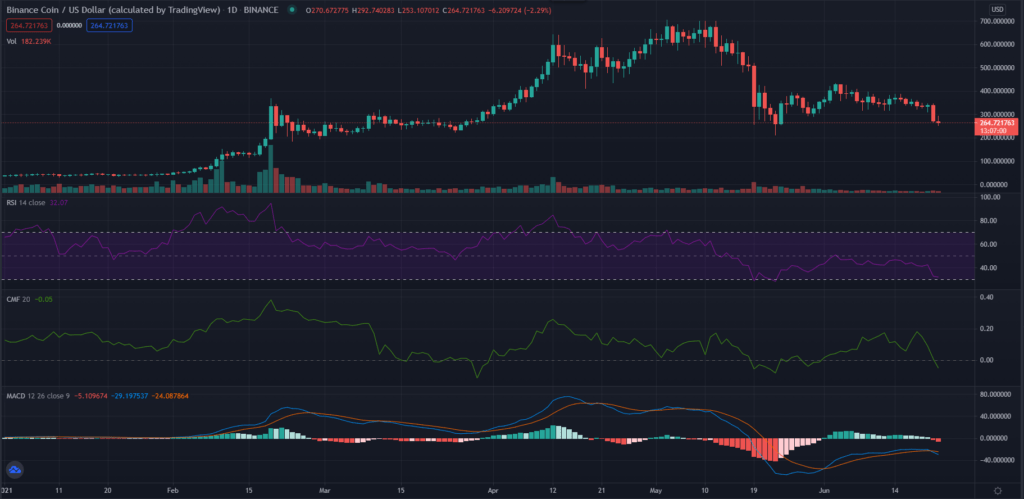
BNB 1 day:
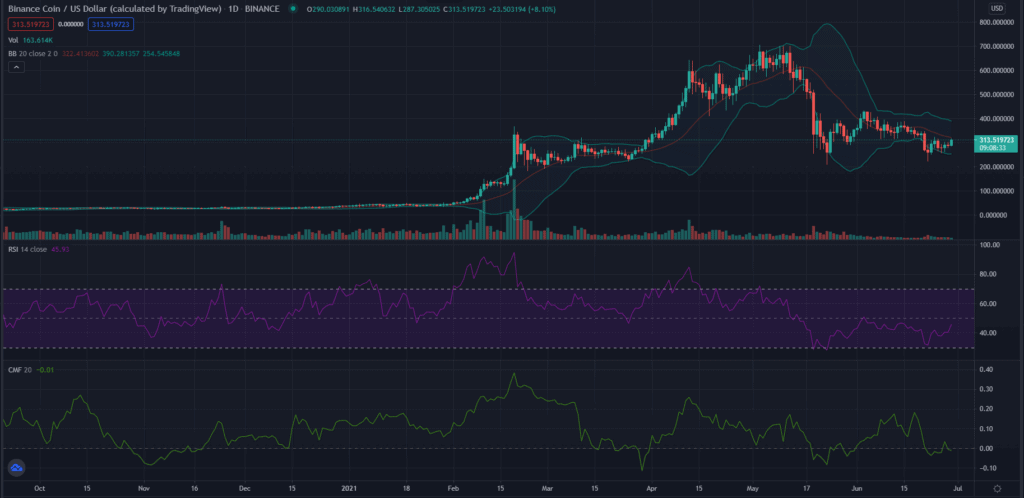
Over a long time, BNB’s performance has been bullish compared to its counterparts. Binance’s rising popularity has been one of the major contributing factors for this. The cryptocurrency’s movemenet has been punctuated by bearish dips but the altest surge should do it good to break from its shackles.
The Bollinger bands moved parallel to each other as the bear run played a significant role in the long term chart. Daily candle growth prompted users to buy into the BNB market. The number is expected to grow as the graph shows a sharp incline. Only the RSI in the long term sided with the bear with the dip pulling it before the zero line.