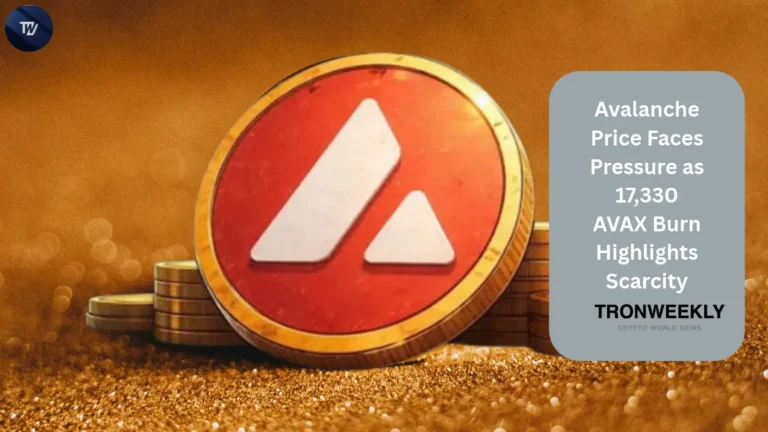
Avalanche’s token-burning system provides a long-term supply narrative, yet deteriorating technical indicators show that AVAX requires stronger buying pressure to sustain a recovery.
Table of Contents
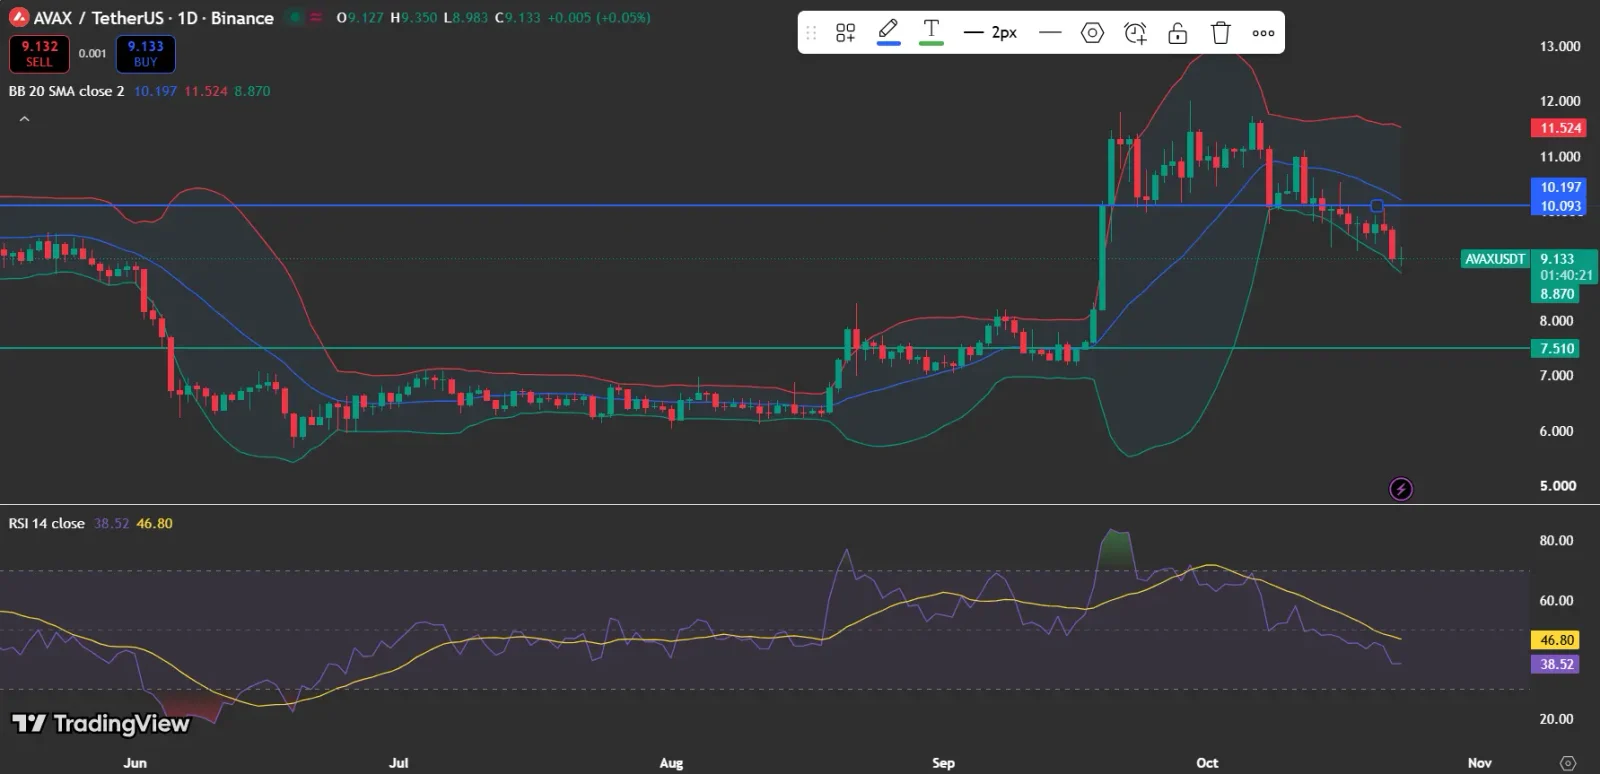
At press time, Avalanche price is trading at $9.133, with the daily TradingView candle showing a gain of approximately 0.05%. The token continues to trade below its recent peaks, while a March 2026 network burn highlighted by AVAX One has renewed focus on its supply dynamics.
Also Read: Avalanche Price Sees Bullish Momentum as 62% of Banks Anticipate Blockchain Adoption
What Does Avalanche Price Have to Do With the AVAX One Burn Data?
In an April 8 article titled Short-Term Yield With Long-Term Scarcity, AVAX One stated that Avalanche burned 17,330 AVAX in transaction fees throughout March 2026. The company additionally reported an average daily burn of about 559 AVAX, reaching a high of 1,082 AVAX on March 23.
These numbers emphasize Avalanche’s fee-burning system, which permanently removes transaction fees from circulation. The reported burn reflects network activity, not an independent token burn carried out by AVAX One.
In its October 23 X post, AVAX One also stated, “AVAX One is structured differently.” The company explained that its treasury strategy combines staked AVAX with businesses that generate cash flow. This describes AVAX One’s treasury approach rather than a direct catalyst for AVAX’s market price.
Also Read: Avalanche Price Eyes $12.23 on $2B India Agri Push
How Does Avalanche’s Tokenomics Influence AVAX Price?
As stated in Avalanche’s official Tokenomics FAQ, AVAX has a maximum supply of 720 million tokens, of which 360 million were minted at genesis. Transaction fees generated on the X-Chain, P-Chain, C-Chain, and eligible Avalanche Layer 1 networks are permanently burned.
At the same time, validators receive newly issued AVAX tokens as staking rewards. AVAX One’s analysis recognizes that staking-related issuance surpassed transaction fee burns in March, indicating that the network had not yet achieved net deflation.
Therefore, fee burns may lower supply compared with what it would otherwise be, but they do not ensure that the circulating supply is declining. Their long-term effect depends in part on network usage and the pace of new issuance.
Also Read: Avalanche Price Stays Strong Above $10 Amid Hyundai Adoption
What Does the TradingView Chart Indicate About Avalanche Price?
The TradingView AVAX/USDT chart indicates that the token is trading below the Bollinger Bands’ middle line at $10.197. The upper band is positioned at $11.524, whereas the lower band is around $8.870.
The Relative Strength Index (RSI) stands at 38.52, below its RSI moving average of 46.80. This suggests that momentum is fading, with sellers maintaining the upper hand for now.
A rise toward $10.197 could indicate improving market conditions, whereas a fall beneath $8.870 would increase the risk of further losses, although a confirmed breakdown would still need to occur.
Can CoinGlass Data Help Assess an Avalanche Price Recovery?
Charts from CoinGlass indicate that open interest has declined from its early-October peak as of October 23. Trading volume has likewise retreated from its late-September surge, while the liquidation chart shows considerable long and short liquidations across September and October.
A declining price combined with lower open interest may reflect reduced derivatives participation, but it cannot by itself establish whether traders are becoming bearish or merely exiting their positions. A lasting price rebound supported by increased trading activity would offer a more definitive indication of renewed demand.
Also Read: Avalanche Price Sets Sights on $12 Following a $245.5M Jump in Tokenized Stocks
What Should Avalanche Price Traders Monitor Next?
AVAX’s long-term supply dynamics support a fundamental narrative, yet its current technical indicators continue to appear weak. Traders may look to the $8.870 lower Bollinger Band as a potential support area and $10.197 as an early indication of recovery.
Stronger price performance, revived trading activity, and ongoing network fee burns together would present a more persuasive outlook than tokenomics alone.
Because cryptocurrency markets remain extremely volatile, traders should assess price action, market sentiment, and forthcoming catalysts before making investment decisions.
Also Read: Avalanche Price Gains Momentum Near $11.40 as Volume Surges
This article contains market analysis and price predictions. These are not guarantees. Crypto markets are volatile. Always DYOR. Not financial advice.