
As of May 1, 2026, Binance Coin (BNB) price continues to trade within a narrow range, showing limited movement over recent sessions. The asset posted a slight daily gain while maintaining a broader consolidation trend. Weekly performance remains negative, reflecting ongoing pressure despite stable positioning across markets.
As of writing, Binance Coin (BNB) price is trading at $618.34, showing an uptick of 0.27% in the past day. The trading volume is down by 21.35% and is currently standing at $1.26 billion. Over the last week, the BNB price has decreased by 2.58%, according to CoinMarketCap.

Also Read: Binance Coin (BNB) Tests Channel Support as Momentum Signals Weak Recovery
BNB Price Holds Structure With Downside Risk
Analyst More Crypto Online highlighted that the BNB price structure has remained the same since February. A new trend has not been proven yet by any breakout or breakdown. The present price movement is still in an internal wave formation, which is a corrective stage.
In this arrangement, a triangle pattern is still valid. It reflects ongoing consolidation and clear market indecision. The balance between buyers and sellers is maintained, and the range is narrowing towards a possible breakout level.

A decline below $591 would undermine the structure. It would shift the outlook and require a reassessment of the trend. In case of increased selling pressure, downside targets identified by analysts are at $559, $528, and $491.
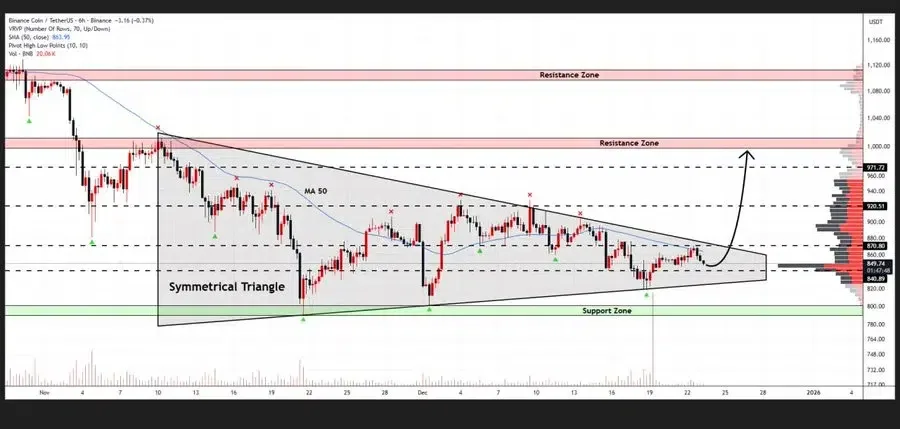
Furthermore, another analyst, Whales Crypto, mentioned that BNB is drawing a symmetrical triangle on the 6-hour chart. The trend indicates that the price is compressed as it approaches the apex.
An increase in volume around this level may confirm a breakout. The analyst added that a sustained move could support a broader rally, with projections extending toward the $1,000 level.
Open Interest Stabilizes as Funding Turns Positive
According to CoinGlass data, the open interest rose along with the price, and then a steep spike signified heavy speculation. Both metrics were subsequently reduced, indicating liquidations. Open interest is now stabilized, with decreased leverage and a more balanced structure.

Funding data also reflected a shift in sentiment. The OI-weighted funding rate shifted to negative values in March to largely positive values in April. A recent figure of 0.0025% suggested a slight long bias. There is no evidence of an excessive accumulation of leverage.

RSI Neutral, While MACD Shows Declining Strength
The Relative Strength Index (RSI) is in a neutral range. The RSI value stands at 47.43, while its moving average is at 51.82. The indicator remained lower than its average with a bit weaker momentum. There is no intense buying or selling pressure.
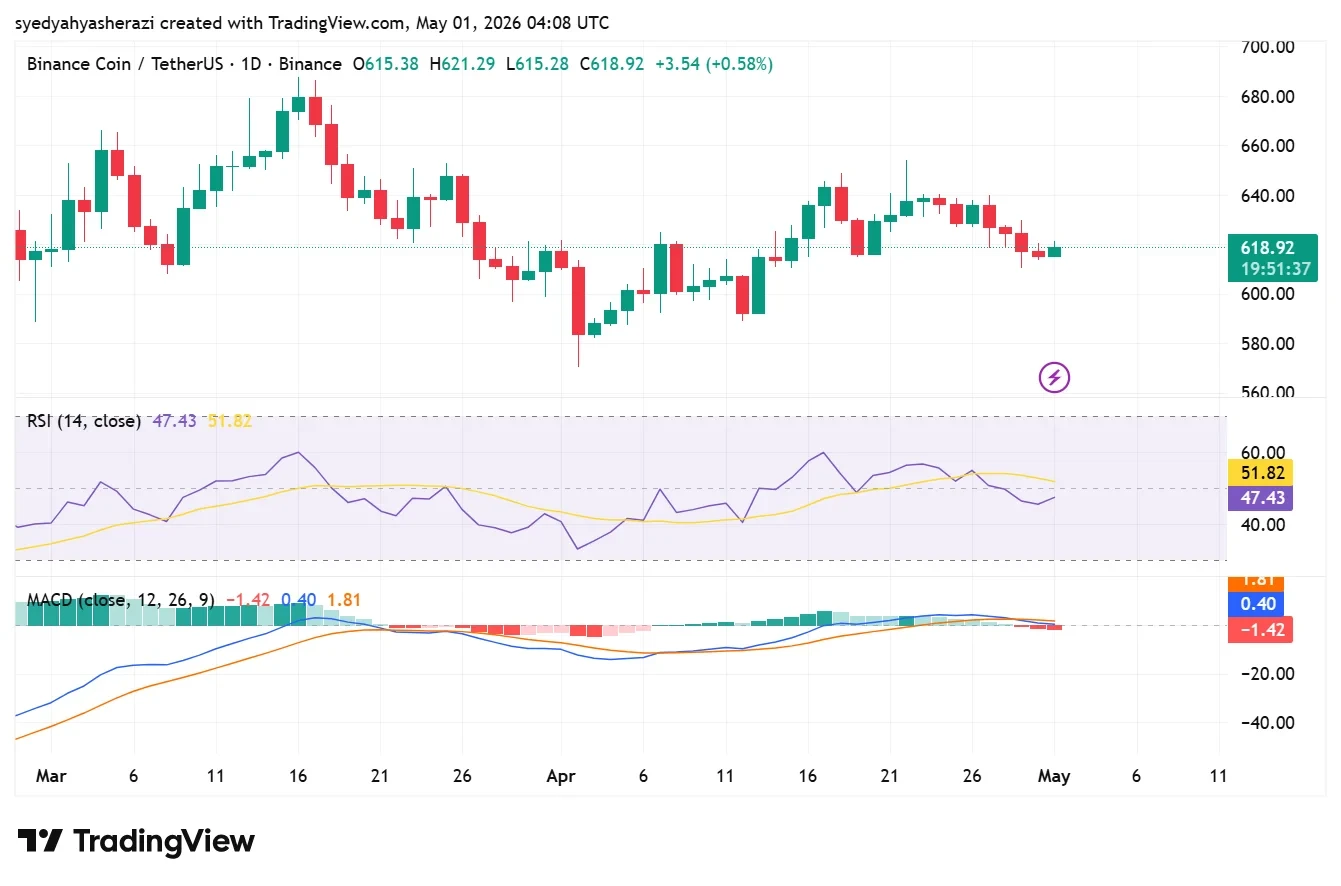
The Moving Average Convergence Divergence (MACD) indicated decreasing power. The MACD line stood at 0.40 with a signal line of 1.81. The histogram showed -1.42, which indicates declining bullish momentum. This setup aligned with the ongoing sideways movement in price.
Also Read: COTI Price Analysis Signals Reversal Potential as Support Holds Strong