- Bitcoin trades at $117,880 with a 0.03% dip; volume drops 45.99% to $64.4B, but weekly gain hits 9.03%.
- RSI at 73.49 signals overbought zone; MACD shows strong bullish momentum with rising histogram bars.
- Analysts target $150K if momentum holds, but warn of a correction if support at $115K breaks.
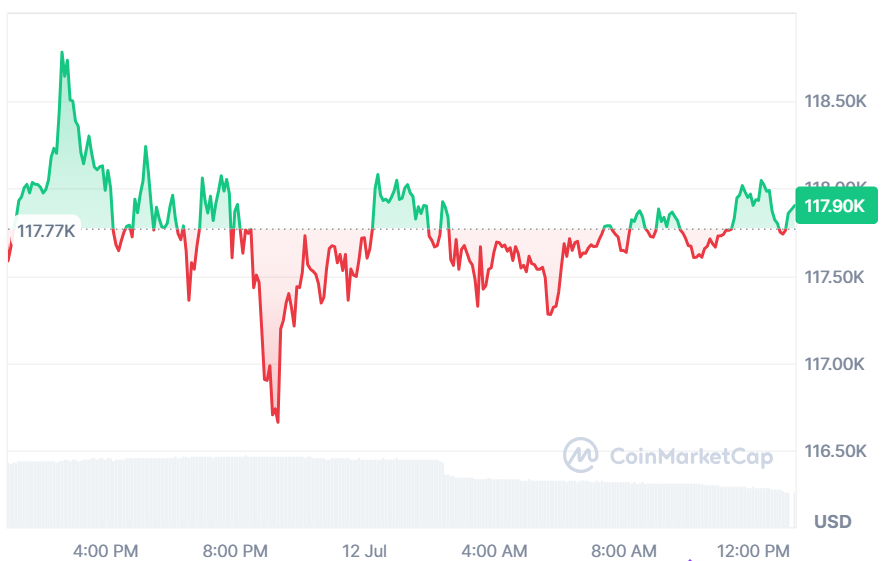
Bitcoin is currently trading at $117,880 after experiencing a decrease of 0.03% in the last 24 hours. The same period trading volume is also down by 45.99%, with the figure standing at $64.4 billion. The Bitcoin price has jumped by 9.03% in the past week.
Source: CoinMarketCap
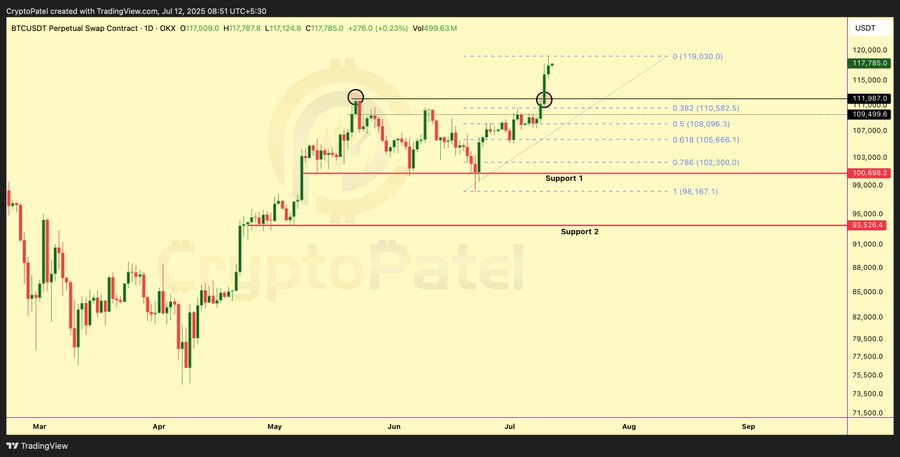
Analyst Crypto Patel highlighted the historical close and drew attention to the current all-time high of $118,880. The critical question being posed by investors at the moment through his post was whether Bitcoin will rally to $150,000 or drop back to reassert the $100,000. The market is still divided, as analysts predict the market can continue further in both directions, depending on upcoming trading days.
Source: X
Volume and Interest Trends
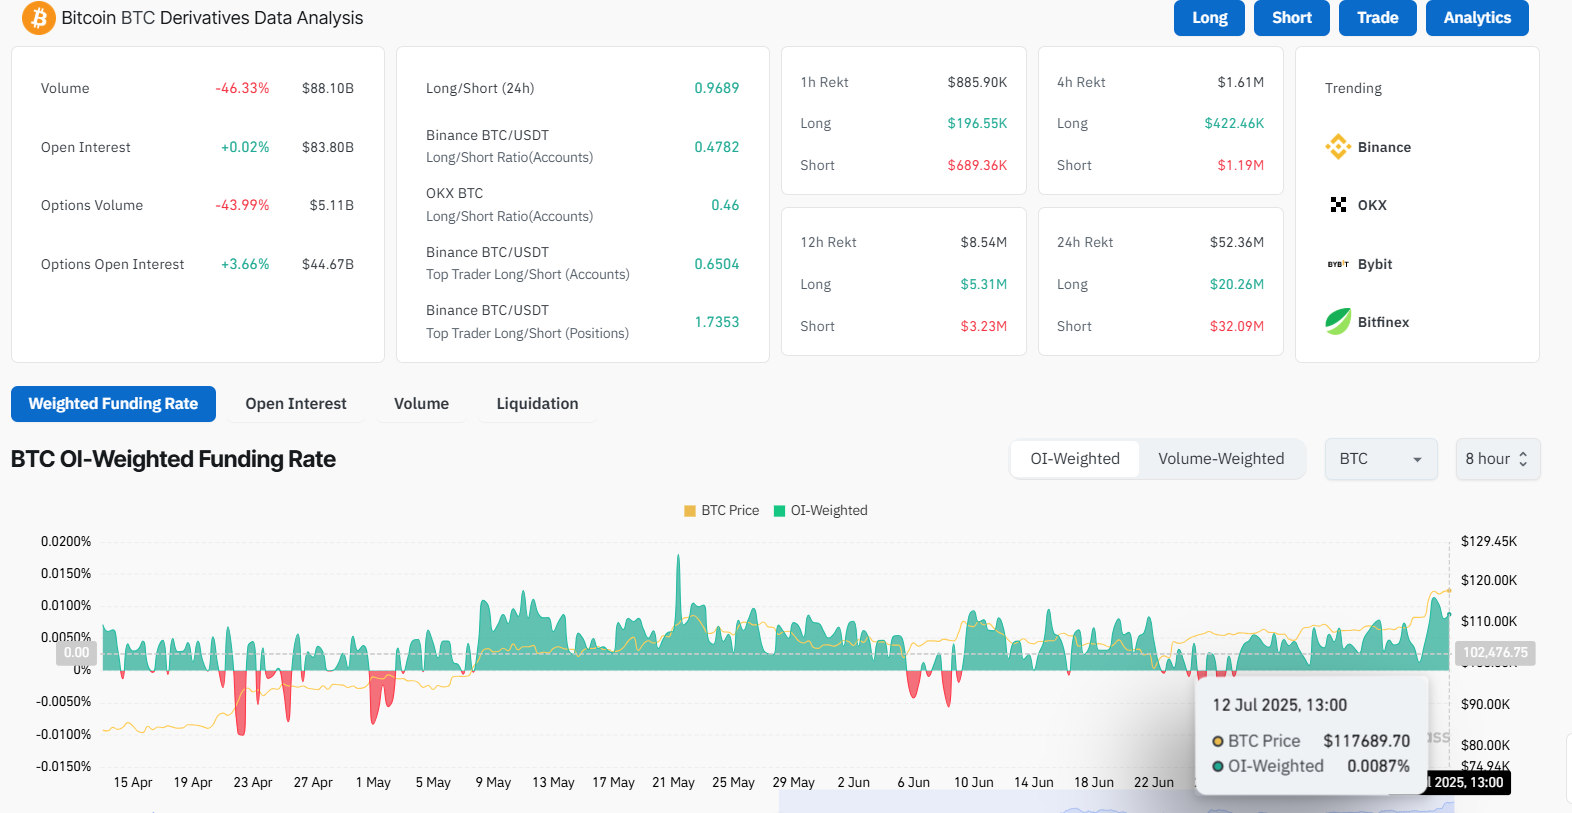
CoinGlass data shows that the 24-hour trading volume plunged by 46.33% to $88.10 billion. The Open Interest has experienced a slight increase of 0.02% to reach $83.80 billion. The BTC OI-weighted funding rate is unchanged and maintained at 0.0087, which means that buyers and sellers are balanced in terms of leverage.
Source: CoinGlass
Also Read: Bitcoin Hits $118,500 ATH as CZ Predicts More Dips Ahead: Report
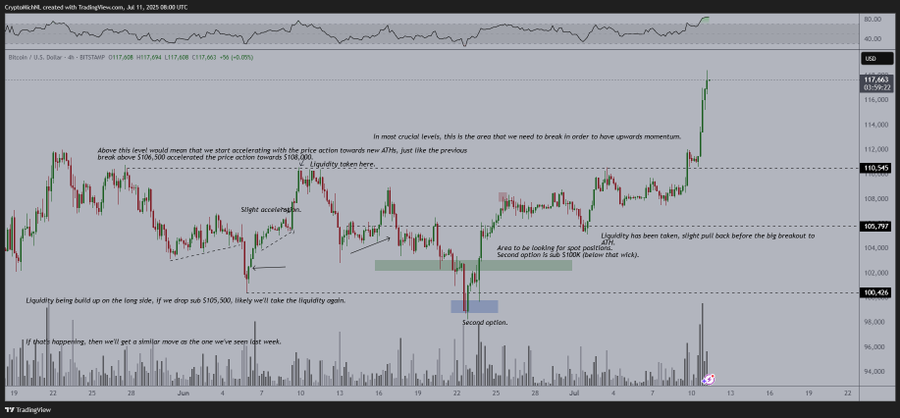
Michael van de Poppe revealed that Bitcoin has finally jumped out of its multi-week range. He anticipates a short period of consolidation followed by a further upswing. He predicts that it could reach as far as $125K in July, then perhaps up to $150K in Q3, and way into the realm of $250K at the year-end.
Source: X
Bitcoin Shows Strong Momentum
The Relative Strength Index (RSI) is at 73.49, putting Bitcoin in the overbought region. RSI levels greater than 70 are normally viewed as a potential short-term correction but the longer-term readings are still positive with RSI being above 60. The traders are advised to be cautious in the case of a sharp change of momentum.
MACD (Moving Average Convergence Divergence) also provides an additional indication of the bullish momentum. The MACD line is now at 2,555.58, but the signal line remains behind at 1,498.27. Increasing spread and widening histogram bars indicate strong buying pressure and make the trend strengthen further.
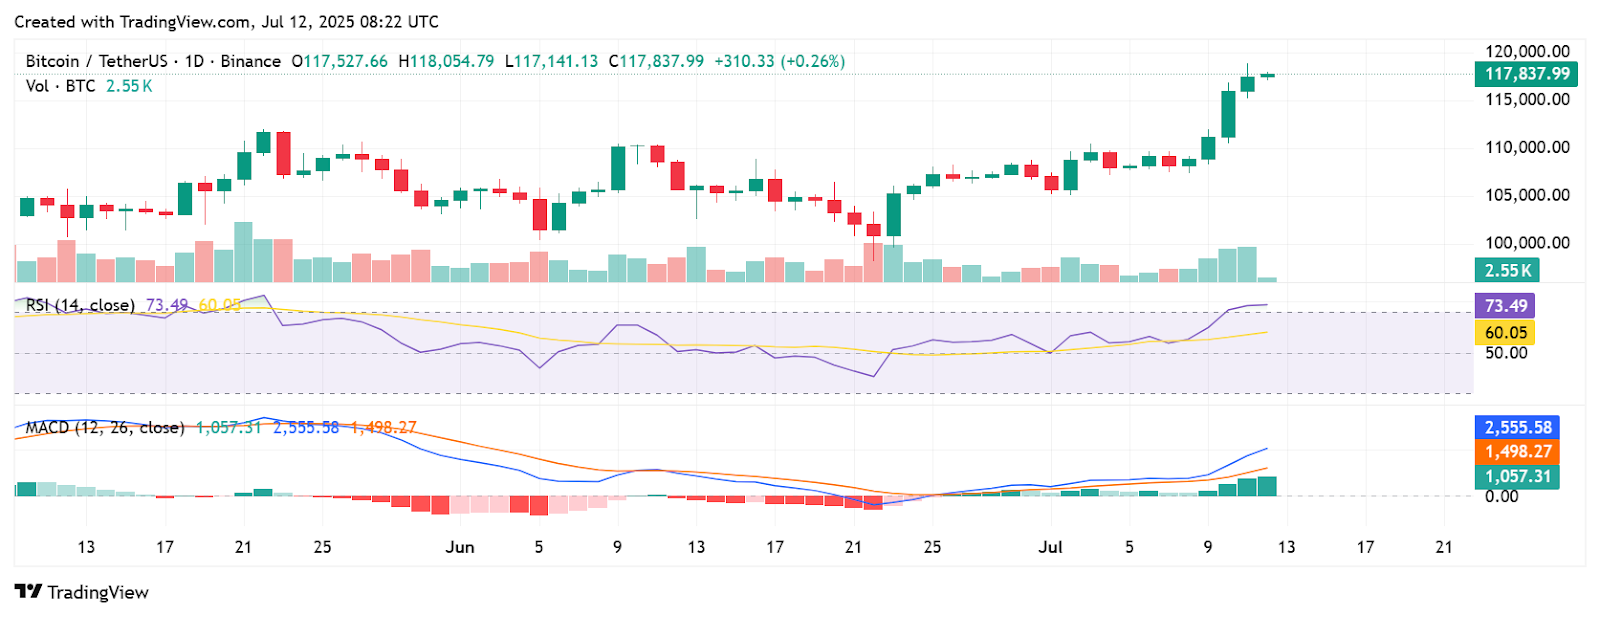
Source: TradingView
Bitcoin is at a new shift point. If it cleanly jumps over the 120K mark, then it should begin to shoot higher into the 125K-150K range. Nonetheless, the inability to retain existing support at approximately 115K could trigger a steep correction. The market is now awaiting confirmation of the next significant move.
Also Read: Bitcoin Breaks $116,000, Targets $130,000 As ETF Inflows Ramp Up
Disclaimer: This article is based on real-time market data and general technical observations. It does not constitute financial advice. Always conduct your own research before making investment decisions.