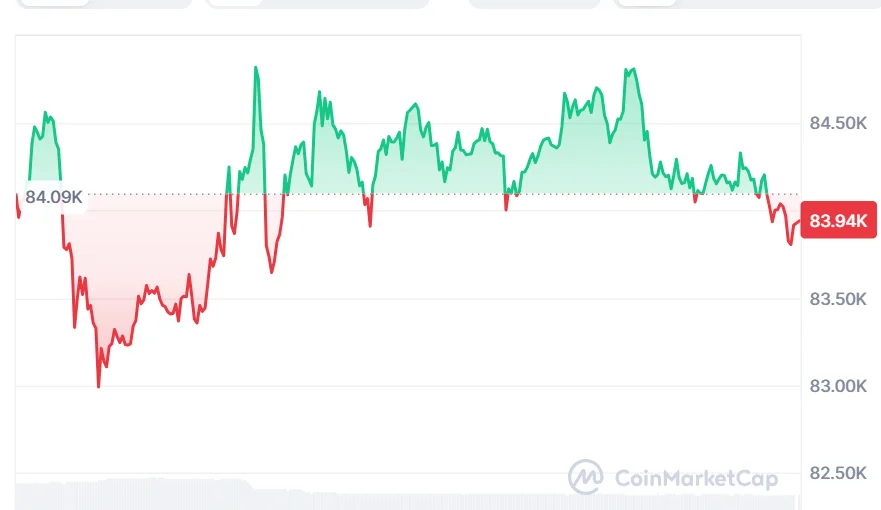
Bitcoin price is consolidating around the $84,000 region following a decline from the $87,000 region, with investors looking out to see whether the coin will reclaim the resistance level or head lower to support.
Table of Contents
At the time of writing, Bitcoin is trading at $83,943, with a 24-hour trading volume of approximately $41.66 billion and a market capitalization of $1.69 trillion. BTC has slipped 0.57% over the last 24 hours.
Also Read | BNB Price Holds Its Ground at $770 amid High Trading Volume
Bitcoin Price Holds Bullish Structure After Pullback
On September 25, a crypto analyst, That Martini Guy, pointed out that BTC has pulled back after touching the $87,000 range. Based on the observation made by Martini, the four-hour chart is still positive despite the pullback.
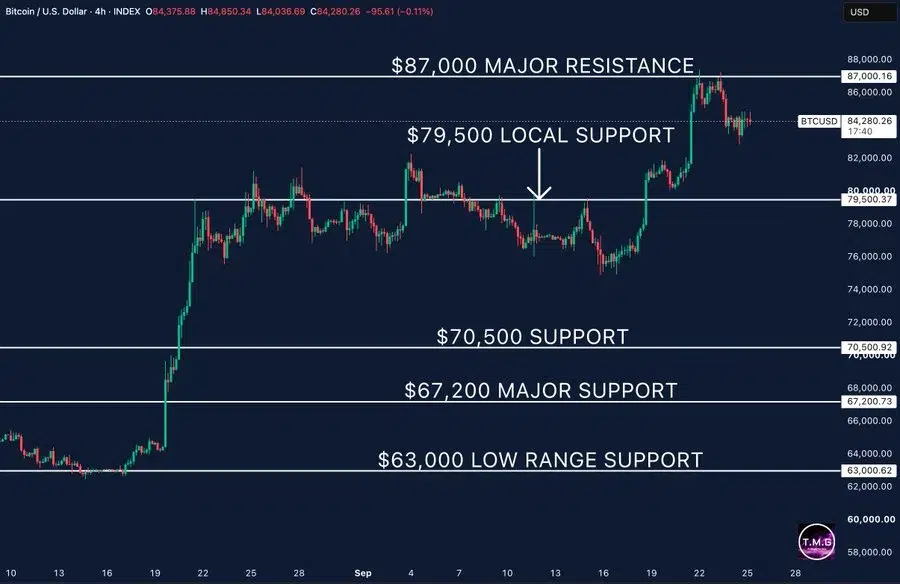
The current price action reveals an impressive upside run from the mid-$70,000 range to be rejected at $87,000.
The price action above $87,000 is now becoming a significant level for the Bitcoin price. It will mean that the buyers are trying to regain momentum again once they move past this level.
In addition, the Martini Guy pointed out that $79,500 is an important support level should the pullback continue deeper.
It is also worth noting that the Bitcoin price is near its four-hour Bollinger Band middle line level.
At the moment, it is difficult to say that there is an evident change in the trend. What is currently happening can be considered the consolidation after an important upward correction.
This is important, as Bitcoin has already made a strong upward move from the levels achieved in July and August. Consolidation can serve as the foundation for the next range.
Bitcoin Price Holds Bullish Structure as Momentum Cools
The Bollinger Bands for BTC also confirm that BTC is still trading in the upper part of its range.
The upper Bollinger Band is located at $86,798, while the middle band is located at $79,957. The lower Bollinger Band is located at $73,116.
Since Bitcoin is trading above the middle Bollinger Band, the overall four-hour structure continues to remain bullish. But since Bitcoin is close to the upper Bollinger Band, it is also evident why the $87,000 level has gained importance.
If Bitcoin crosses above the upper Bollinger Band and continues to trade above $87,000, then the overall bullish structure will be strengthened. However, a move below the middle Bollinger Band would increase the chance of retracing to $79,500.
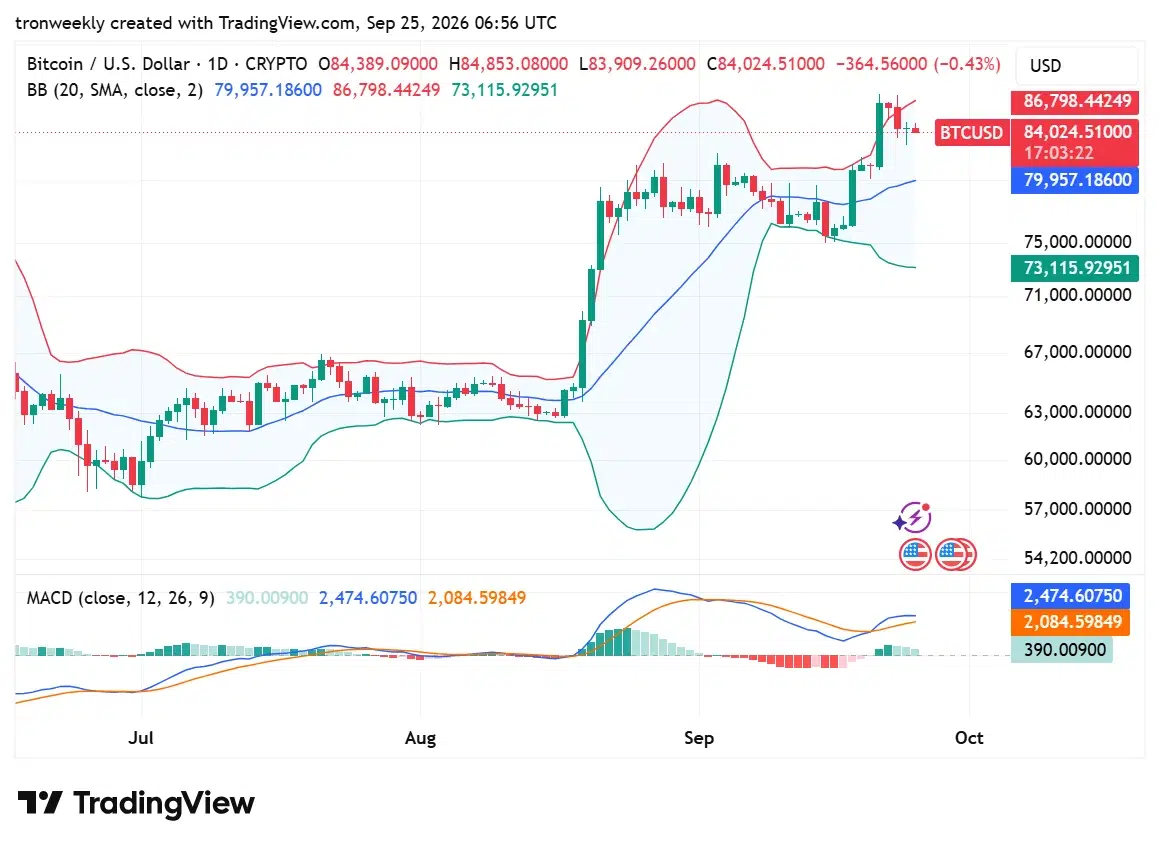
MACD continues to be positive as well. MACD line is at 2,474.61 against the signal line at 2,084.60, with a histogram value of 390.01.
It is evident that there is still a presence of upward momentum even though a price drop seems to have reduced momentum from its former level.
October Seasonality Adds Another Catalyst
Another area that is getting focus is the performance of the cryptocurrency in October in the past.
A well-known crypto analyst, Ali Martinez, mentioned in a recent tweet about the coming October period and talked about the past performance of the cryptocurrency, which has been favorable in the month.
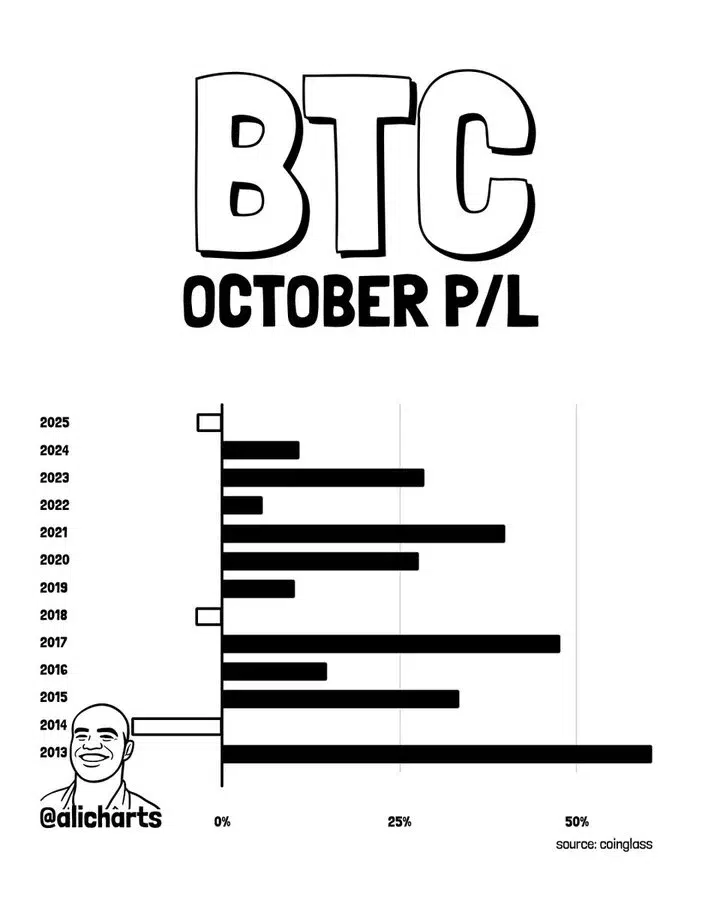
This past data gives us information about something, but it is not directly predictive for October 2026 for the price of Bitcoin.
What Happens Next for Bitcoin Price?
The primary attention will remain on the $87,000 resistance and $79,500 support zone.
Any break above the $87,000 level will bring the recent tops into play and can indicate that the present consolidation period may come to an end. In the meantime, any deeper fall towards $79,500 will reveal how committed buyers are to the existing recovery formation.
First of all, the crucial thing to note is that the breakdown of the recovery of the Bitcoin price still hasn’t been spotted. The current trading pattern of BTC is in a balancing position, sitting between the latest rejection at $87,000 and the support level of the range from $79,500 to $80,000.
With October fast approaching, investors will see how BTC manages to combine both its technicals and institutional buying power.
Also Read | LINK Price Eyes Breakout Toward $15 as Network Activity Signals Momentum
This article contains market analysis and price predictions. These are not guarantees. Crypto markets are volatile. Always DYOR. Not financial advice.