
Bitcoin is holding up near $81,000, whereas Ethereum is struggling below a significant resistance level.
These contrasting price movements come as US spot Bitcoin ETFs record net inflows, while Ethereum ETFs post sizable outflows. Such contrasts provide clues about institutional investment behavior and the technical levels that traders are monitoring.
Table of Contents
As of press time, Bitcoin was changing hands at $81,602, while Ethereum stood at $2,412, a decline of 1.20% over the last 24 hours.
Also Read: Bitcoin Price in Focus as On-Chain Activity and Technical Signals Converge
Bitcoin ETFs See $15.86 Million in Inflows
Based on Lookonchain’s October 16 update, US spot Bitcoin ETFs posted net inflows of 194 BTC, valued at roughly $15.86 million. Still, the seven-day net flow stayed negative at 1,643 BTC, equal to about $134.56 million.
BlackRock’s IBIT brought in 204 BTC, while Grayscale’s GBTC logged an outflow of five BTC. A number of other funds reported no net flows for the session.
The positive daily number points to renewed investment activity, even though the negative weekly flow shows that Bitcoin ETFs have faced wider selling pressure of late.
Also Read: Standard Chartered Launches, Ethereum Trading for UAE Wealth Clients
Ethereum ETFs Shed $60.84 Million
Ethereum ETFs moved in the opposite direction, posting daily net outflows of 24,792 ETH, worth approximately $60.84 million. Their seven-day net outflows totaled 119,753 ETH, valued at around $293.85 million.
BlackRock’s ETHA fund saw outflows of 18,099 ETH, while Grayscale’s ETHE recorded withdrawals of 7,697 ETH. Fidelity’s FETH was among the funds with positive flows, bringing in 1,004 ETH.
These numbers point to sustained pressure on Ethereum investment products over both daily and weekly periods. Even so, ETF outflows by themselves cannot dictate ETH’s future price path, since broader market sentiment and derivatives activity also shape price movements.
Also Read: Strive Buys 2,822 for $235M as Holdings Reach 35,595 BTC
Bitcoin vs Ethereum Price: Key Levels to Watch
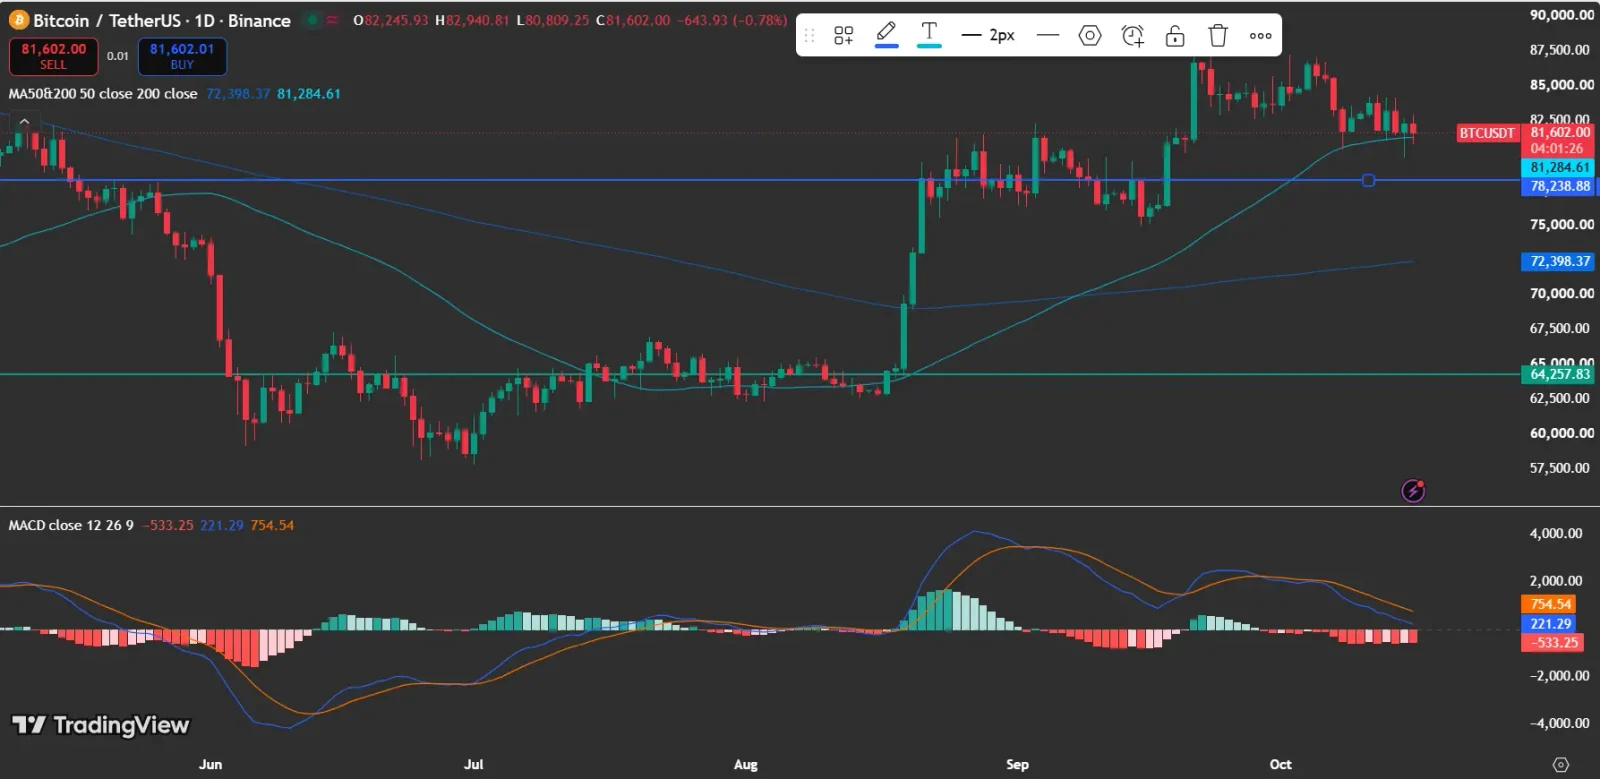
On Bitcoin’s daily chart, BTC is trading at $81,602, just above its 200-day moving average of $81,285. Staying above this level may reinforce its technical picture, while $78,238 is another price point to keep an eye on.
Its 50-day moving average stands at $72,398, offering a benchmark for possible support should the price fall further.
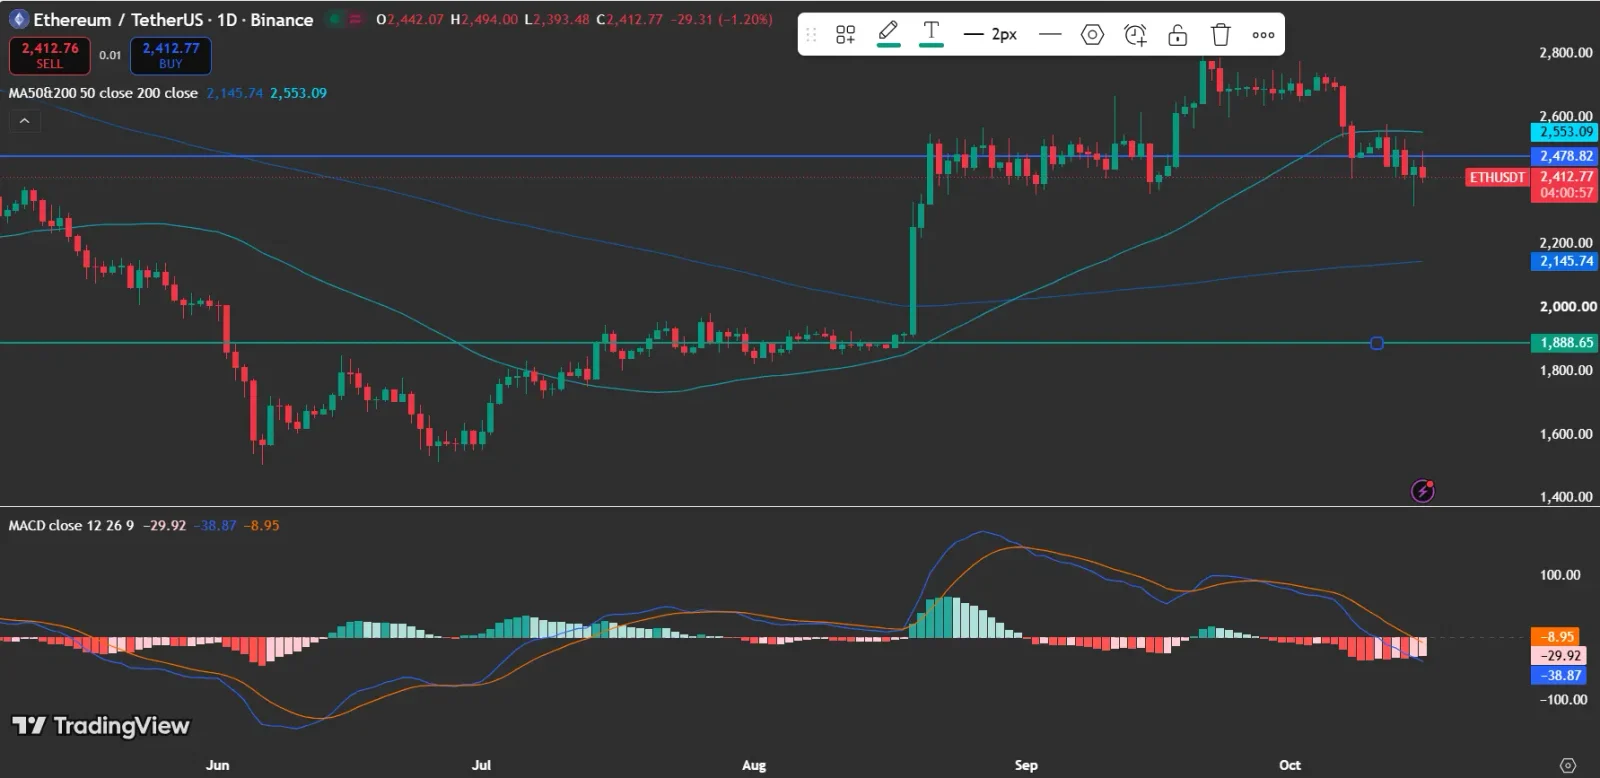
Ethereum, in the meantime, is trading at $2,412, under its 200-day moving average of $2,553. The $2,478 level marks another zone of resistance, while the 50-day moving average at $2,145 offers a possible support reference.
Regaining the $2,478–$2,553 range could strengthen Ethereum’s technical outlook. Until that happens, ETH stays beneath its longer-term moving average.
Also Read: U.S. Becomes Net Importer for the First Time Since 2022
What Comes Next for BTC and ETH?
Bitcoin’s positive daily ETF inflows stand in contrast to Ethereum’s considerable outflows. Still, this gap does not mean BTC is certain to outperform ETH.
Traders will monitor whether Bitcoin holds above the $81,285 moving average and whether Ethereum can reclaim its resistance zone.
Additional ETF flow updates, trading volume, and derivatives data may help clarify whether the divergence between the two assets persists.
Also Read: Bitcoin Price at Crossroads: $84.2K Breakout or $80K Drop?
This article contains market analysis and price predictions. These are not guarantees. Crypto markets are volatile. Always DYOR. Not financial advice.