
Bitcoin price slipped below $84,000 after reaching $87,197 on Friday, while analysts remain divided over whether October can produce a recovery toward $100,000. ETF flows, spot demand, futures positioning, and macro conditions now sit at the center of the outlook.
Table of Contents
Andreas Brekken, founder of SideShift.ai, is looking forward to a busy October. He added that investors would be able to come back to crypto as the capital shifted towards the SpaceX IPO and expected to see it reach $100,000 “in weeks.”
Other analysts pegged their predictions to actual purchases. Bitfinex, Nansen, and Bitget Wallet’s price forecasting primarily emphasized market sentiment on the spot rather than on October’s historical events.
What Is Holding Back the Bitcoin Price?
Bitcoin dropped below $84,000 before the minutes of the Federal Reserve were published on Oct. 7, Bitfinex said. It resulted in a 24-hour crypto futures liquidation of $510.6M, comprising a $417.6M long liquidation.
Also Read: Webull Shares Fall 30% After House Panel Flags China Ties
However, $300 million of those long positions were sold off in about an hour. However, open interest at all the major perpetual markets was 0.5% higher as of October 7 than it was on October 5.
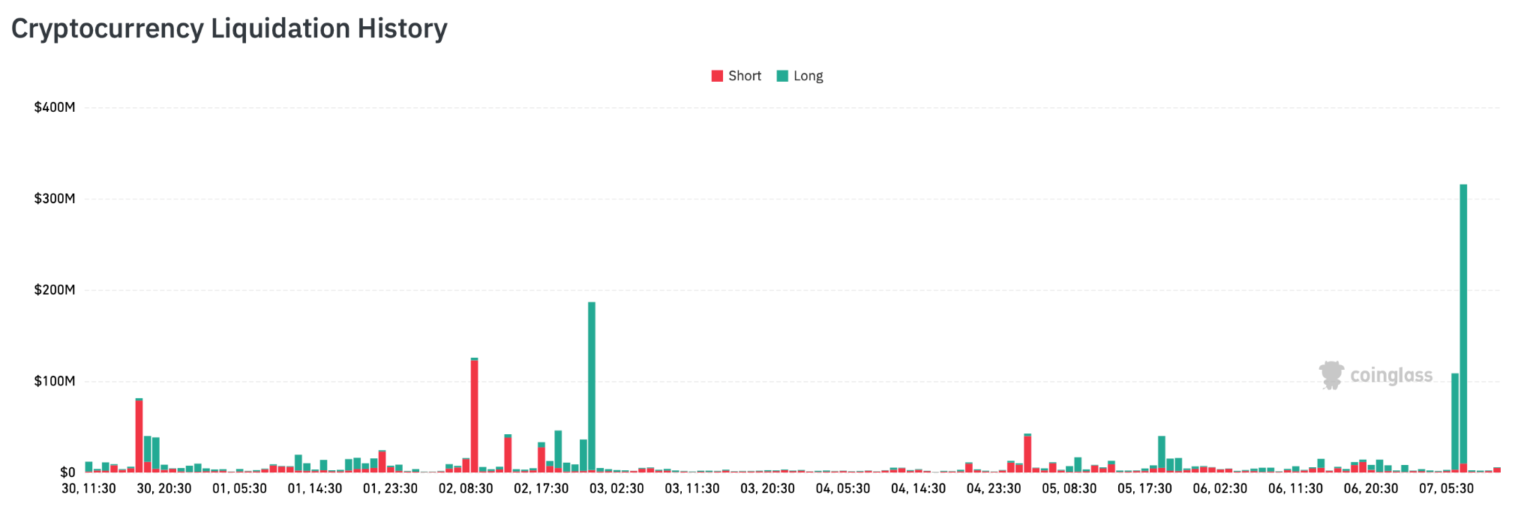
This Bitcoin price drop thus eliminated leveraged long positions but didn’t severely reduce market exposure. Bitfinex stated that it was likely that the new buys offset the traders who were forced out during the sell-off.
The average annualized funding rates are still positive at 5% to 6.5%. Much of the fresh positioning was attributed to the analysts, who thought that a lot of short sellers came in when Bitcoin lost its support.
If those short positions are to be affected, it will be due to the “stronger buying in the spot market,” Bitfinex said. It could push the Bitcoin price back towards the $87,722 annual opening if demand picks up.
Why Did the $87,197 Breakout Fail?
Friday’s move to $87,197 relied heavily on futures activity, according to Bitfinex. Open interest climbed by $2.1 billion before the September U.S. payrolls report, then fell by $1.5 billion after its release.
Spot buying failed to keep pace. The Bitcoin price then returned toward $84,000 after its third rejection below the yearly opening level within two weeks.
Bitfinex expects consolidation between $84,000 and $87,722 unless demand improves. It said several ETF sessions with at least $340 million in inflows, combined with a daily close above $87,722, could support a move toward $90,000.
The firm placed ETF investors’ estimated average purchase price at $84,320. That level also helps explain why buying appetite has softened as many holders returned close to breakeven.
Why ETF Flows Matter for Bitcoin Price
ETF flows have been reduced since the end of September. According to Bitfinex, weekly U.S. spot Bitcoin ETF flows declined to $241.1 million from $2.39 billion.
Martin Lee, data lead at DWF Labs, was not particularly worried about a one-time drop of roughly $90 million. He believes that the weekly and monthly figures paint a better picture of institutions’ interests.
Between September 21 and 25, there were $2.39 billion worth of flows into U.S. spot Bitcoin ETFs. Of that amount, BlackRock’s IBIT gained $1.16 billion, Fidelity’s FBTC $701.6 million, and ARK 21Shares’ ARKB $294.7 million.
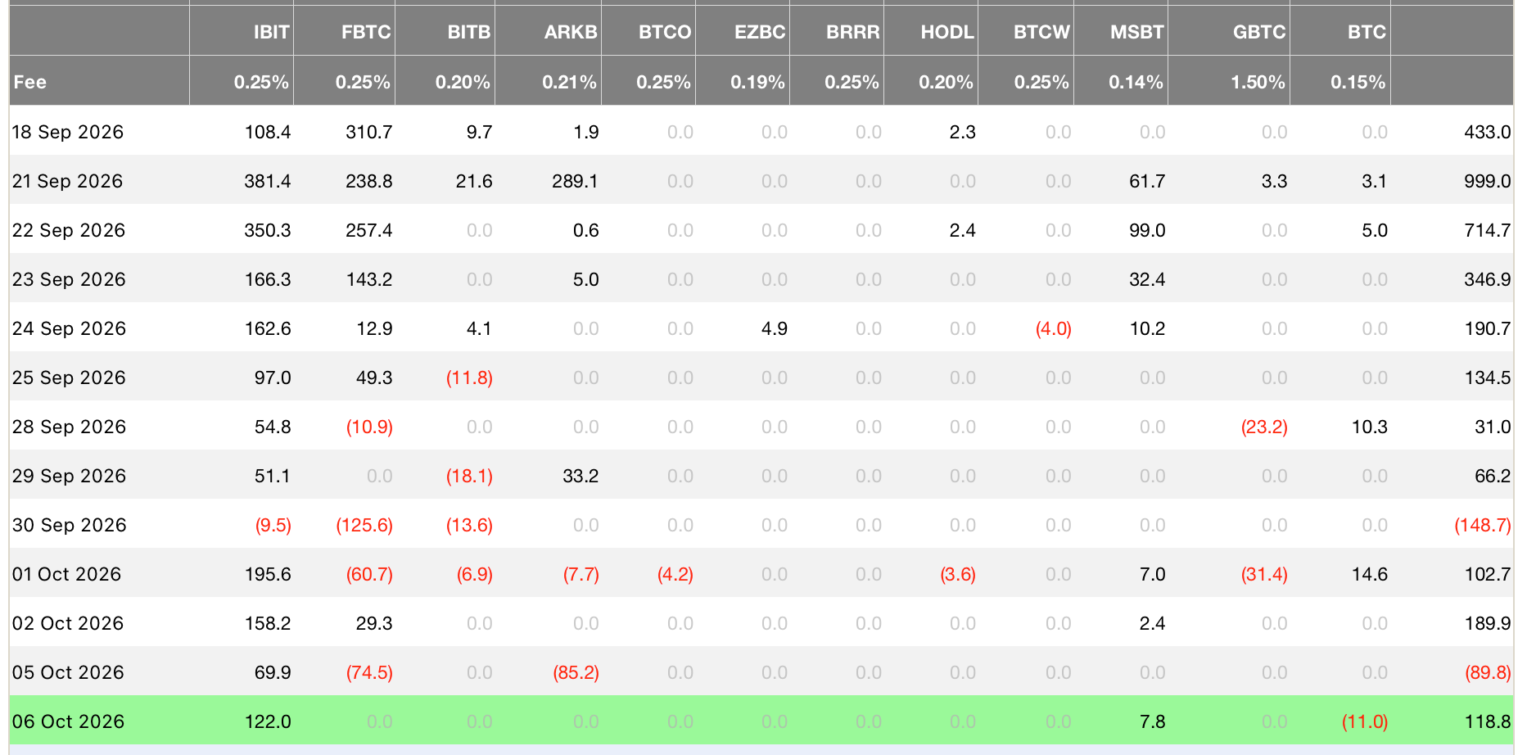
The future trajectory of Bitcoin prices will depend more on a consistent stream of inflows than one day’s figure. Bitfinex continues to watch the speed of purchases after the abrupt weekly slowdown.
Can October Push Bitcoin Price Toward $100K?
The median return of bitcoin has been around 14% since 2013, according to Nansen senior research analyst Jake Kennis. The digital currency has had upwards movements in 10 of the last 13 months, including October.
However, Kennis stated that liquidity and positioning, macro environment, and actual demand were more significant than any day of the calendar. October is too short to be used as a bottoming indicator.
Lacie Zhang, research director of Bitget Wallet, also emphasized the significance of macro liquidity and ETF inflows. She referred $90,000 to $93,000 for the BTC price should the yields from Treasuries turn out to be lower and inflation data to be even lower.
Increased spot buying, positive inflows into ETFs, and a convincing break higher would be required to see the price moving above the $87,400 level, Zhang said. But those obstacles would have to be surmounted before the price of Bitcoin reached $100,000.
Among the next big macroeconomic tests for BTC will be the release of the US CPI data for September on October 14. If the report turns out to be positive, according to Bitfinex, Bitcoin will remain range bound but will make a second attempt to rally higher.
Also Read: Robinhood Bitcoin Purchase Adds $25M in BTC to Its Balance Sheet