
Dogecoin (DOGE) shows a possible bullish reversal after briefly breaking key support and quickly reclaiming it, a pattern seen in past major rallies. However, current technical indicators reflect short-term bearish momentum for the DOGE price, so further confirmation is needed before any sustained upward trend can be expected.
At the time of writing, DOGE is trading at $0.1033 with a 24-hour trading volume of $707.98 million and a market capitalization of $17.5 billion. Despite the 2.48% loss over the last 24 hours, the real question is whether the token can maintain its position to keep the bullish trend intact.

Source: CoinMarketCap
Also Read: Revolut Launches Dogecoin Debit Card: Strong Target of 100K Daily Crypto Payments
DOGE Price Pattern Signals Potential Bullish Reversal
Furthermore, the crypto analyst Trader Tardigrade highlighted that the DOGE price chart has once again drawn strong trader attention after briefly breaking below a key monthly support zone before sharply reclaiming it.
This fake breakdown structure is being compared to previous cycles where similar moves preceded major expansions, with traders noting how the DOGE price behavior often resets sentiment before strong directional moves emerge.
Traditionally, it is possible to state that the DOGE price follows the similar outline in critical points of the cycle.
Thus, in 2017, the breakdown, followed by its recovery, laid down the foundation for the record-breaking rally of 29,000%. Moreover, the same pattern in 2020 resulted in gains of around 16,000% amid the general hype in the meme coins’ sector in 2021.
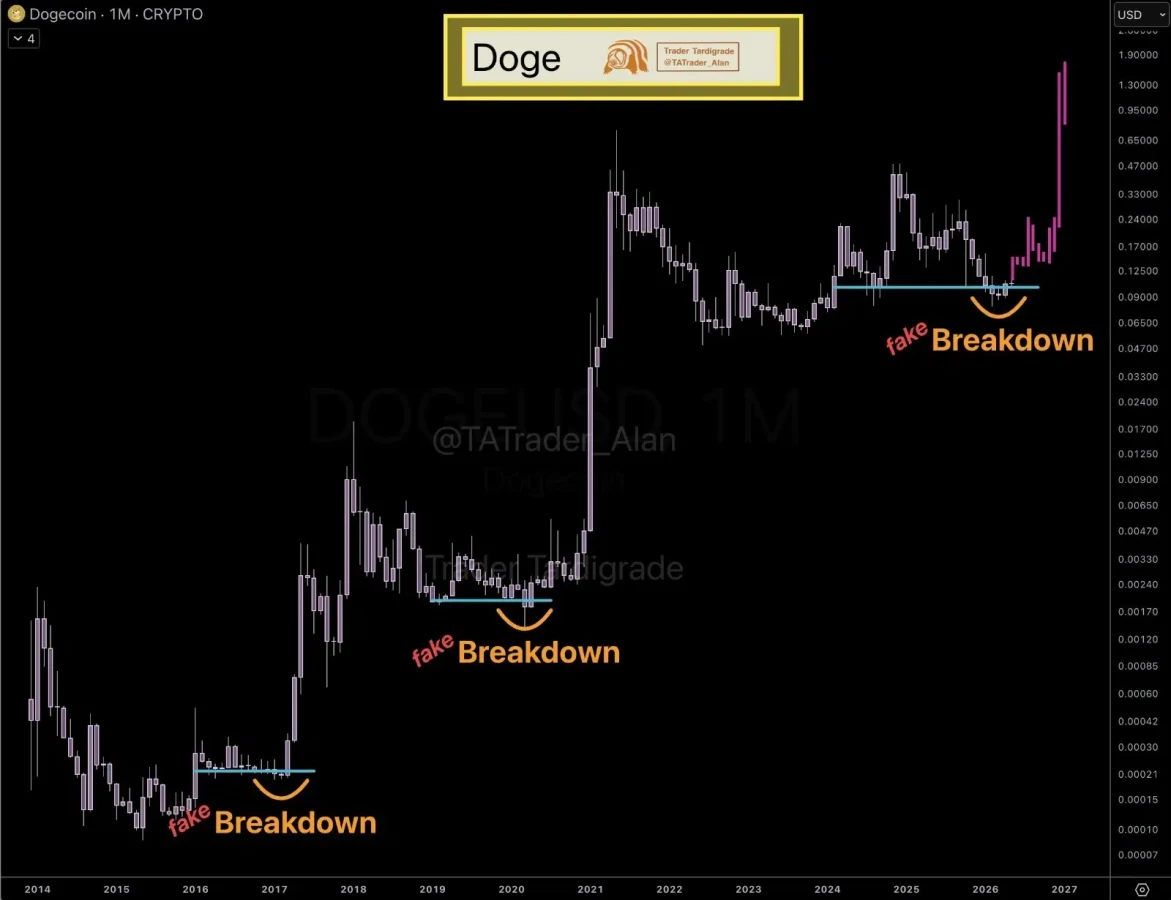
Source: Trader Tardigrade’s X Post
Within the current scenario of 2026, a lot of discussion has revolved around the fact that there is a reclaimed area of support in the form of a platform from where a breakout can take place if the bullish momentum continues for the DOGE price.
Rumors are going around among traders speculating that the potential target if everything works out in line with previous cycles could be at the $1.90 level.
Technical Indicators Point to Cautious Optimism
According to TradingView, the DOGE price outlook transitions from stability during the spring season into a new technical instability.
Following the break above the $0.1200 mark in early May, the DOGE price retraced back down to reach about $0.10398. The price has fallen below the 20-day simple moving average and is testing critical support at $0.10209 on the lower Bollinger Band.

Source: TradingView
MACD shows an increase in selling pressure. While the first upsurge took place in May, the blue line of the MACD has since been moving down beneath the orange one.
Both the MACD and the signal lines are declining towards zero, with an ever-growing gap between them shown by red bars on the histogram.
This article contains market analysis and price predictions. These are not guarantees. Crypto markets are volatile. Always DYOR. Not financial advice.
Also Read: Dogecoin Price Signals Repeat Cycle Structure With $2 Long-Term Target in Focus