
VIRTUAL remains structurally bullish after reclaiming key levels following a sharp dip, with traders eyeing a support retest for continuation. Short-term momentum has cooled, showing consolidation and selling pressure for the VIRTUAL price, but ecosystem expansion and new listings continue to support longer-term growth potential.
At the time of writing, VIRTUAL is trading at $0.7382 with a 24-hour trading volume of $117.36 million and a market capitalization of $486.13 million. Despite the 2.12% loss over the last 24 hours, VIRTUAL shows potential for a breakout amid bullish structure and network growth.

Source: CoinMarketCap
VIRTUAL Price Eyes Breakout With $0.80 in Focus
According to the crypto analyst Scient, the VIRTUAL price chart has shown strong technical structure after a sharp deviation below its parallel channel and key daily support.
The VIRTUAL price briefly swept liquidity, shaking out weak hands, before quickly reclaiming lost levels. A higher low formed precisely at the 0.786 Fibonacci zone, reinforcing bullish structure and suggesting the broader uptrend remains intact despite volatility.

Source: Scient’s X Post
Traders are now watching for a potential retest of the $0.77–$0.80 daily support area as a key long opportunity. Rather than chasing the rebound, market participants prefer patience for confirmation on a revisit of this zone.
If the VRTUAL price holds this support, it could act as a foundation for continuation after this classic deviation and reclamation move.
Also Read: VIRTUAL Price Forecast: Can Bulls Reclaim $0.80–$0.82 for Further Upside?
Technical Indicators Point to a Cooling Off Period
According to TradingView, the VIRTUAL price follows a volatile market that stabilizes around $0.60-$0.80 for a little while before shooting above $0.90 in early May.
The VIRTUAL price peak faced strong resistance, leading to an immediate drop to $0.70. A short recovery saw the VIRTUAL price increase to $0.73672; however, there is still an indication of sell-off based on the higher wick.
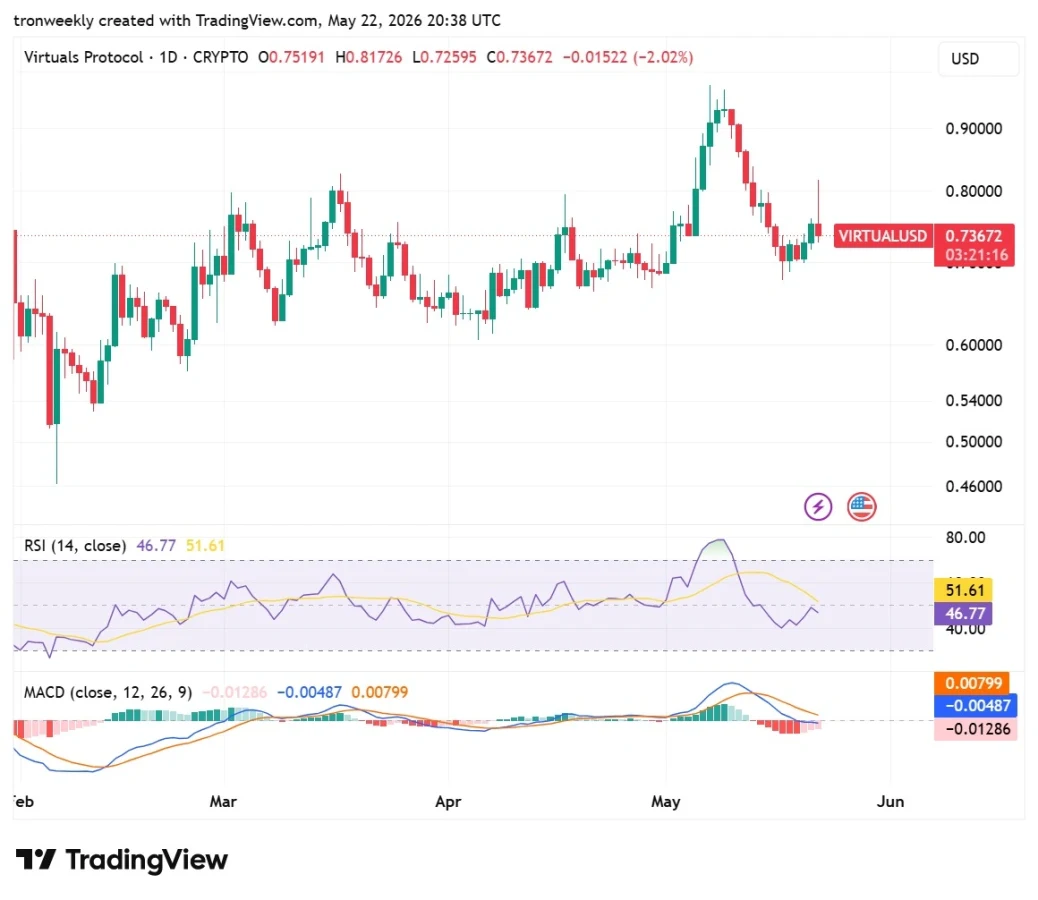
Source: TradingView
Technical indicators are showing signs of a breeze blowing into a chill. The Relative Strength Index (RSI) has declined to 46.77, slipping below the yellow signal line and below the neutral level of 50, indicating favor towards sellers.
Meanwhile, the moving average convergence divergence line has dropped below the orange signal line, resulting in red bars on the histogram.
Bithumb Lists Virtuals Titan, Boosting Korea’s Crypto AI Market
The data from Virtuals Protocol further highlighted that the release of Virtual Titans has now found its place on Bithumb, further cementing the network’s deep dive into the fast-growing Korean world of cryptocurrency and artificial intelligence.
With technology adoption, retail involvement, and use of AI-based Web3 products moving swiftly here, the Korean environment serves as an ideal testing ground.

Source: Virtuals Protocol’s X Post
The Virtuals Protocol’s builder-centered ecosystem is expanding to provide projects an opportunity to get in and grow within Korea and elsewhere. The solution ranges from helping projects launch and raise money to distributing successfully.
Through this method, Korea will be more than just another place where projects can list themselves but a gateway into the world.
This article contains market analysis and price predictions. These are not guarantees. Crypto markets are volatile. Always DYOR. Not financial advice.
Also Read: VIRTUAL Price Faces Resistance at $0.80: Can Bulls Push It Toward $1 Target?