
Virtuals Protocol (VIRTUAL) is pulling back from recent highs and testing key support while facing strong resistance that is limiting upside momentum. Technical indicators show weakening momentum and increasing bearish pressure for the VIRTUAL price. Derivatives data also reflects caution, with lower participation, reduced leverage, and declining trading activity overall. According to CoinMarketCap, VIRTUAL is trading at $0.7217 with a daily decline of 4.99%.

Source: CoinMarketCap
VIRTUAL Derivative Data Point to Cautious Optimism
According to Coinglass, the VIRTUAL open interest declined by 8.67%, totaling $85.79 million, indicating reduced outstanding derivative positions and weakening trader commitment. This suggests lower leverage usage, increased position unwinding, and cautious sentiment in the market.
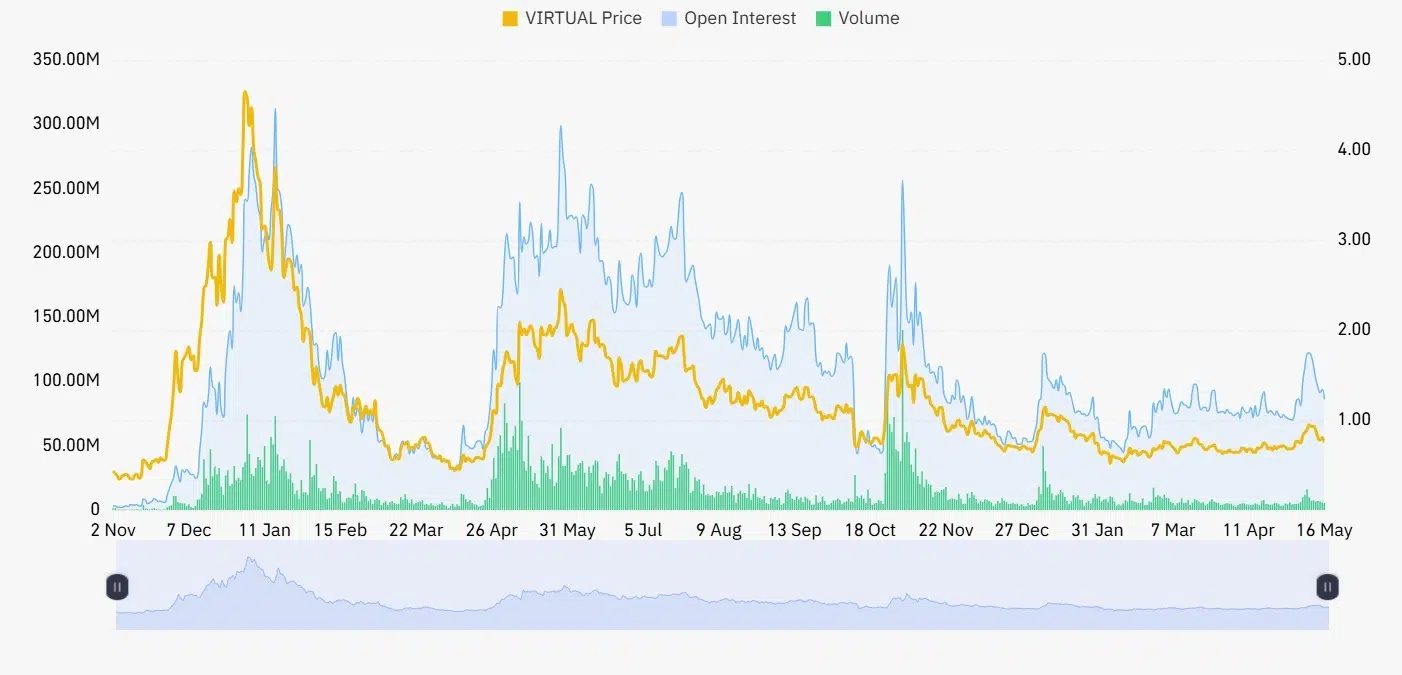
Source: Coinglass
Trading volume decreased by 17.19%, reaching $106.95 million, indicating reduced market activity and weaker participation compared to previous levels, reflecting lower liquidity, cautious sentiment among traders, and short-term hesitation in executing larger market positions.
Also Read: VIRTUAL Bullish Setup and Rising Open Interest Point to a Rally Toward $0.90
VIRTUAL Price Breakout Could Trigger $1 Rally
Furthermore, the crypto analyst Scient pointed out that the VIRTUAL price seems to be building a solid bullish pattern by progressively establishing new highs and lows within an uptrend channel formation.
The VIRTUAL price has targeted the critical resistance level of $0.78-$0.80, which has acted as the ceiling for any gains since January. The upside breakout will strengthen the trend further.

Source: Scient’s X Post
The region corresponds to the Value Area High that formed during the initial May breakout period and is located close to the 0.75 Fibonacci box.
As long as the bulls can keep the support intact and maintain their momentum, a rise towards the psychological $1 mark should be expected. Otherwise, in case of rejection at the resistance, the range-bound motion will continue.
Technical Indicators Point to Downward Pressure
According to TradingView, the VIRTUAL price has corrected sharply from its peak level of $0.95000 in the first week of May.
The VIRTUAL price is down by 3.69% to reach the price level of $0.72140. Now, the price is approaching the important resistance range of $0.70000 – $0.72000. If the price breaks below this critical range, then a fall to $0.65000 is expected.

Source: TradingView
The technicals are starting to paint the picture of an acceleration to the downside as the RSI falls from overbought readings into 42.22, falling significantly below the signal line.
Meanwhile, the MACD is generating a fresh bearish crossover as the blue line crosses below the orange signal line, along with widening red bars.
This article contains market analysis and price predictions. These are not guarantees. Crypto markets are volatile. Always DYOR. Not financial advice.
Also Read: VIRTUAL Price Forecast: Can Bulls Reclaim $0.80–$0.82 for Further Upside?