
Ethereum has entered July with fresh attention from market participants after a new technical signal appeared on its monthly chart, while the blockchain also reached its highest quarterly transaction count on record.
Together, the latest market structure and growing on-chain activity have renewed discussion about Ethereum’s long-term direction. According to Ali Charts, the TD Sequential is showing a monthly buy signal for ETH.
This particular pattern has proven quite reliable in predicting major turning points in recent times, having accurately predicted the September 2021 peak prior to the 78% correction, the 2022 bottom leading into a 235% rally, and another buy signal in March 2025, followed by a move of over 182%.
According to the new chart, there is now another buy signal generated by the cryptoasset for the month, the first in years since its recovery in 2025. This could indicate that selling pressure is waning and the recent decline might soon become another market bottom.

Source: X
Also Read: Circle Expands Stablecoin Payments Across Europe With New Payouts API
ETH Revisits A Familiar Support Zone
The monthly chart indicates that the Ethereum trend is consistent with its past long-term behavior. After steep declines and periods of sideways action, ETH often rallied strongly to fresh highs.
In the first cycle, it declined by 78.15% and then rallied by 235.87%. During the second cycle, it declined from almost $5,000 to about $1,500-$1,600 and rallied by more than 182%.
As per the Ali Chart, Ethereum is back to its primary long-term support zone of $1,500 – $1,600, which has been an accumulation zone before. Being above this zone would preserve its regular cycle behavior; however, closing under this zone on a monthly basis could point to a new trend.
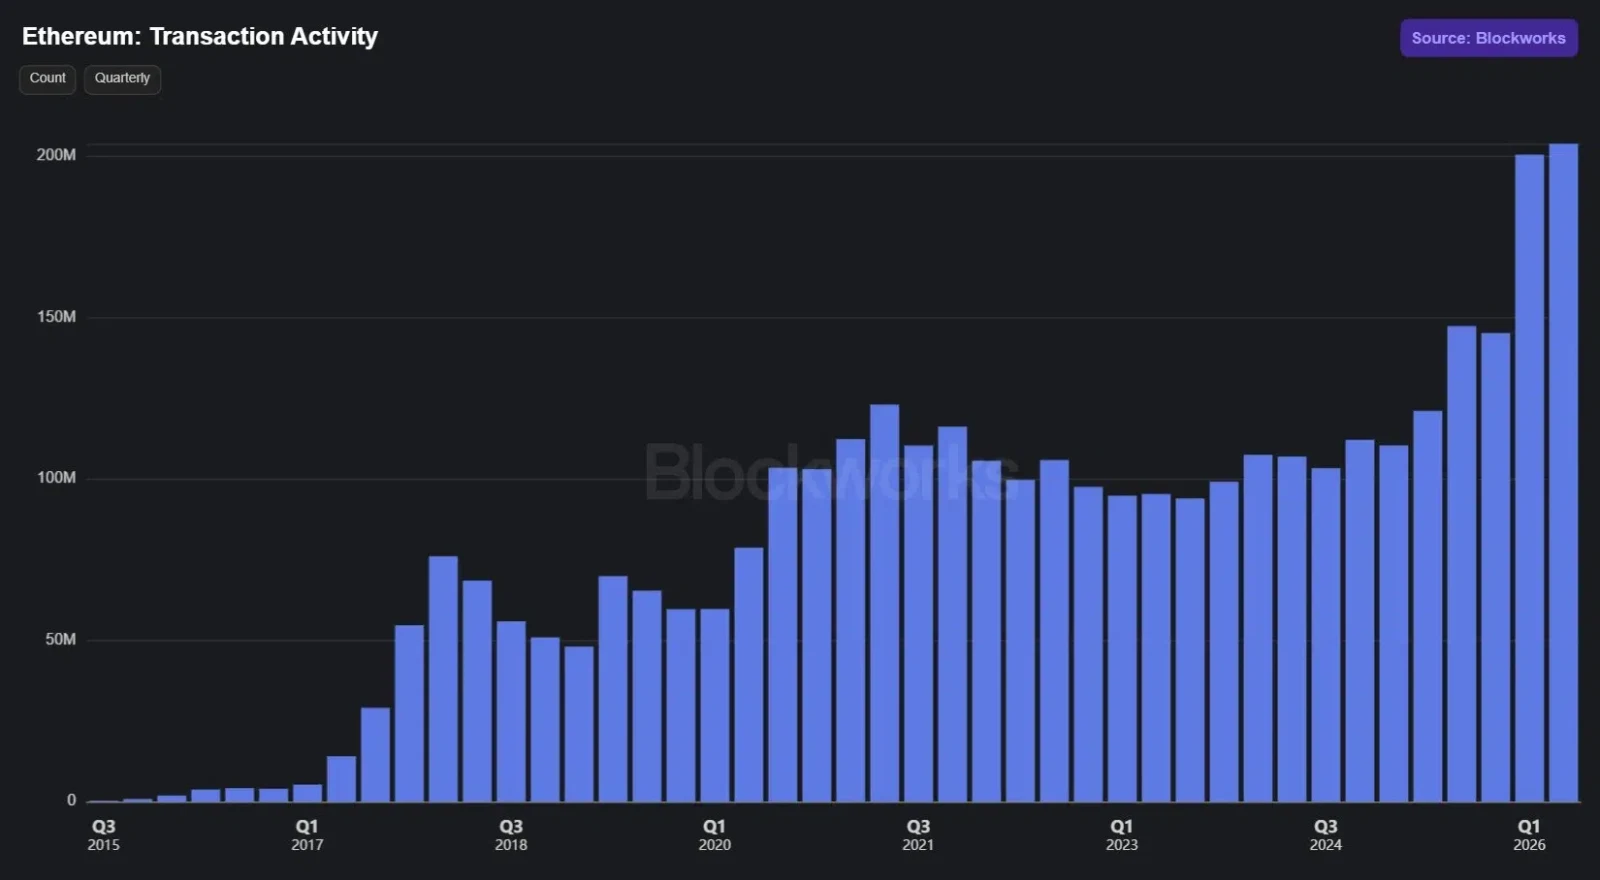
Ethereum Sets New Quarterly Transaction Record
While technical indicators focus on price action, Ethereum’s network activity continues to expand. According to Everstake, the total number of transactions processed by Ethereum in the second quarter of 2026 was 203,851,942; this is the highest number ever for one quarter.
Historical data indicate that at the start of its operations, Ethereum experienced fewer than 10 million quarterly transactions.
Source: X
However, there was a significant increase in the number of transactions in 2017 due to the boom in ICOs, followed by even more growth due to DeFi, NFTs, stablecoins, tokenized assets, and Layer 2 networks. This continued even amid market downturns.
This article contains market analysis and price predictions. These are not guarantees. Crypto markets are volatile. Always DYOR. Not financial advice.
Also Read: ONDO Price Enters Key Accumulation Zone as Analysts Eye $5 Target