
Ethereum (ETH) price has begun to demonstrate some initial stability following a period of selling, although from a structural perspective, this remains bearish for the Ethereum price.
Though there have been brief moments of recovery, the trend does not appear to be set on a path toward reversal at this point, making it likely that focus will remain on buyer activity in the near-term future.
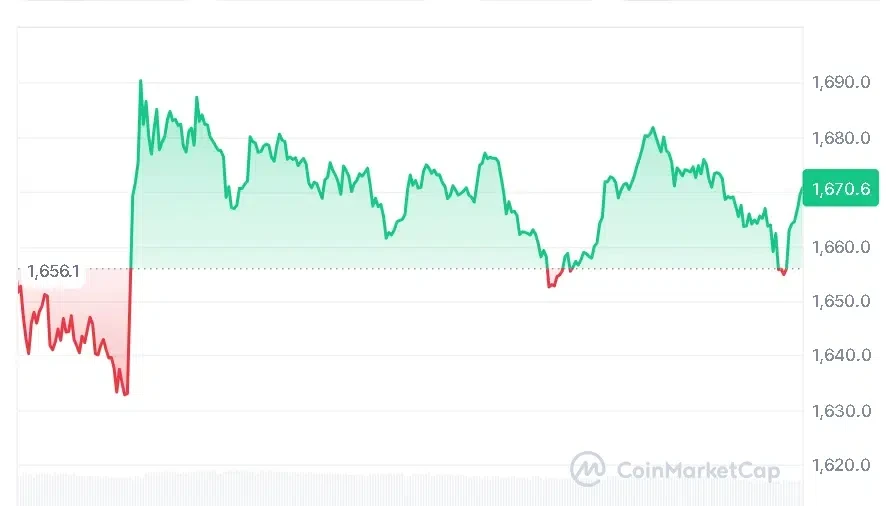
At the time of writing, the ETH is trading at $1,670.61, supported by a 24-hour trading volume of $14.24 billion and a market capitalization of $200.70 billion. Although ETH has recorded a modest 1.06% gain over the last 24 hours, this move appears to be more of a short-term recovery rather than a sustained uptrend in the Ethereum price.
Also Read | Elon Musk Net Worth Surges as SpaceX IPO Hits $1.8 Trillion Valuation
Ethereum Price Stuck in Bear Flag Pattern
As mentioned by crypto analyst Ted, ETH is still trading within the boundaries of the bear flag formation, and it could indicate further negative price action until there is a breakout. In addition, the Ethereum price would have to surpass the resistance at $1,700 to break out to $1,850-$1,900.
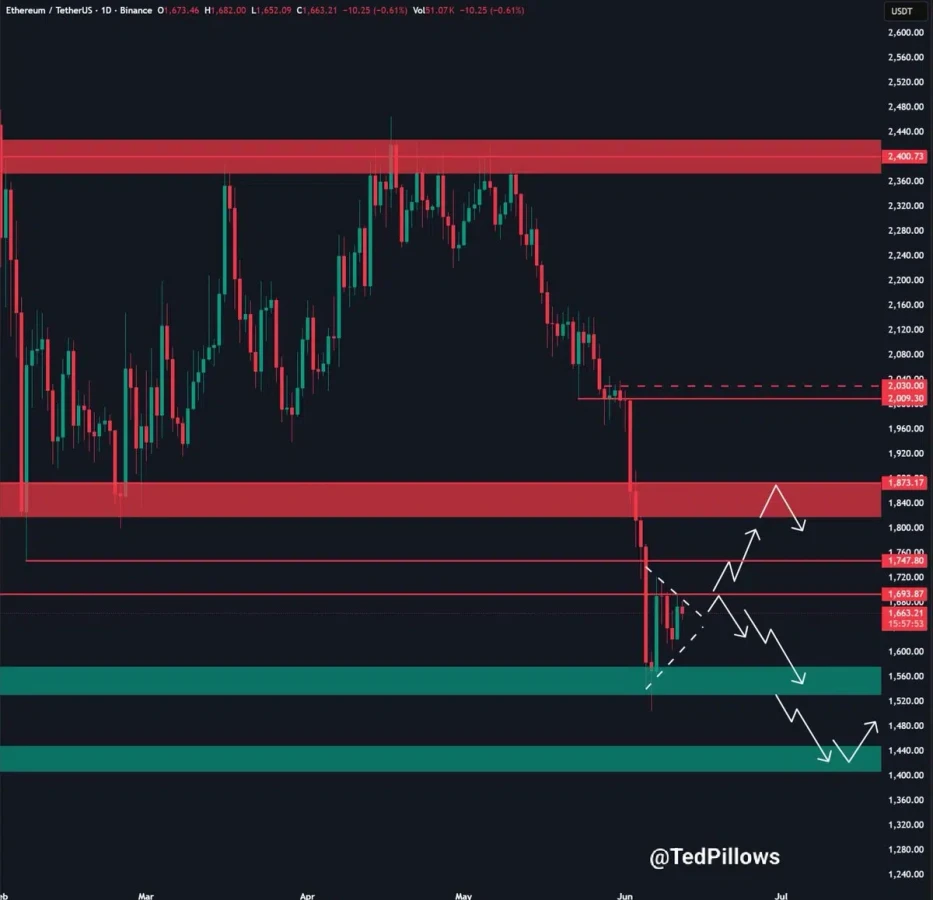
If the Ethereum price fails to breach this range, then there would be continued risk of further decline, with the possibility that the $1,500 support level could be tested once again.
Ethereum Faces Key Technical Resistance After Sell-Off
In technical analysis, the Ethereum price has continued to exhibit weakness after falling from its previous position. In regards to Bollinger bands, it can be noted that there is high volatility with the Ethereum price being traded close to $1,667, which is still below the center of $1,845.69.
This implies that the Ethereum price has not yet stabilized in an uptrend. Previously, the approach of the lower band of about $1,469.62 shows the strength that was exhibited during the selling pressure.
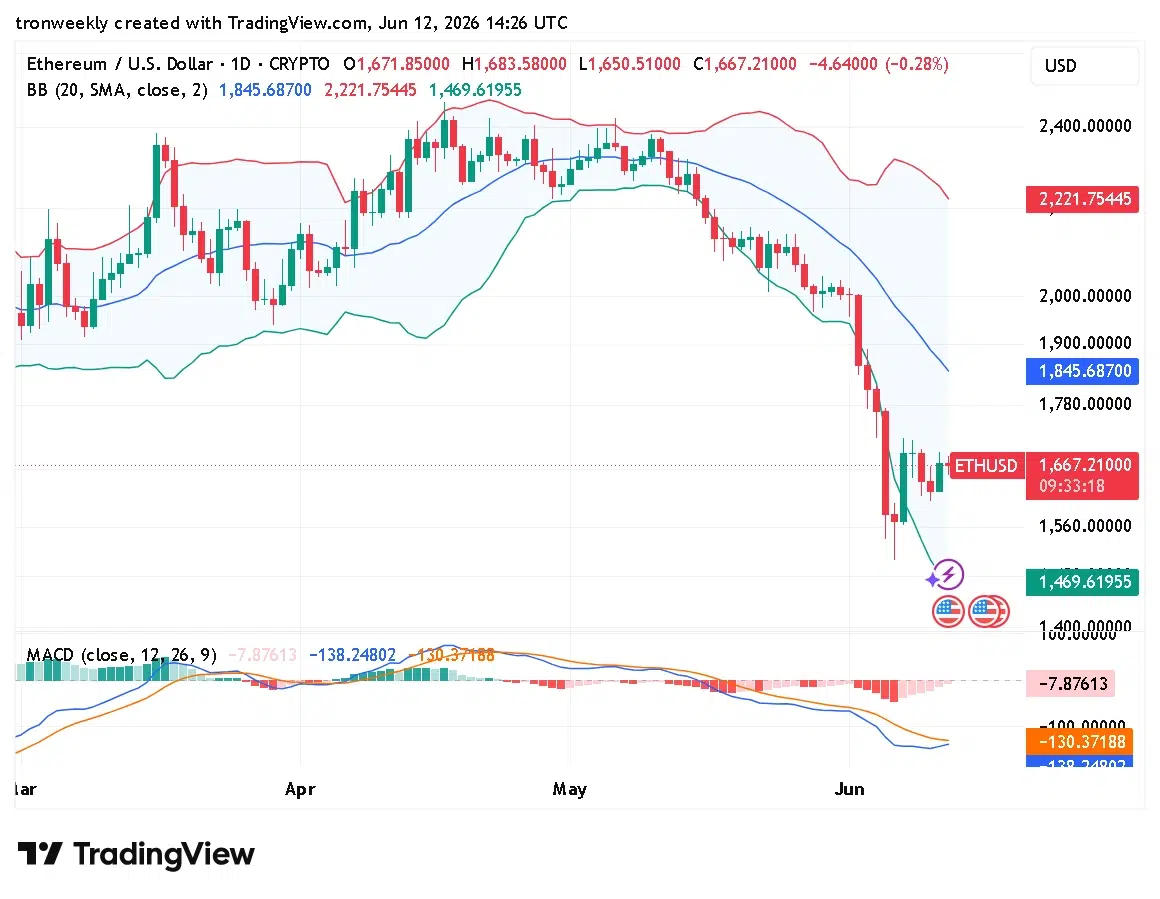
Other indicators show that the Ethereum price continues to face bearish pressure. The moving average convergence divergence stays negative, with the MACD line at about -138.24 and the signal line at around -130.37, indicating that bears are in control.
Though the histogram reveals a little bit of progress and that downward pressure seems to be diminishing, Ethereum has not established a positive crossover to indicate a complete reversal just yet. Without a solid boost from buyers, Ethereum is bound to remain stuck in a range.
This article contains market analysis and price predictions. These are not guarantees. Crypto markets are volatile. Always DYOR. Not financial advice.
Also Read | Metaplanet Acquires Siiibo Securities to Build Bitcoin-Linked Yield Products
