
NVIDIA price is expected to bounce back after a new TD Sequential buy signal was triggered on NVIDIA shares. The pullback happened after the stock failed to break above the key resistance area. However, from the technical point of view, it is obvious that buying interest continues to show. We will see if the price of NVIDIA shares will bounce back to $230.
At the time of writing, the NVDA price is trading at $218.6, recording a 1.54% decline over the last 24 hours. Daily trading volume reached $7.06 billion, while the company maintained a market capitalization of $5.29 trillion. Despite the short-term pullback, the NVIDIA price continues to trade above key support zones, keeping hopes alive for another upward move if buying activity returns.
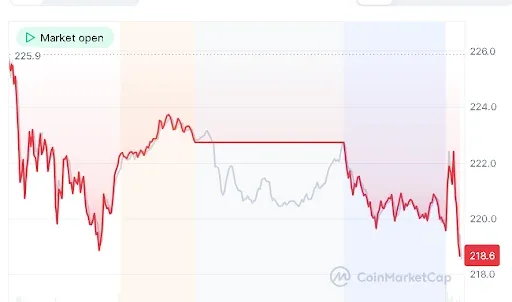
Source: CoinMarketCap
Also Read | ADA Price Analysis: Elliott Wave Pattern Suggests Recovery Target at $0.349
NVIDIA Price Holds Bullish Structure
As per the statement made by crypto analyst Ali Martinez on May 19, 2026, the TD Sequential of NVIDIA registered a new buy signal after its slight retracement. This is because the indicator frequently marks the end of retracements, particularly after rallies, in the case of stocks having solid fundamentals.

Source: Ali Martinez’s X Post
The last correction occurred when the NVIDIA price broke through the $230 level and attracted the sellers, who forced a decline in prices. Despite the recent fall, a lot of investors still consider the overall trend to be bullish since NVIDIA stock is holding above key support levels. The traders are waiting for the current support level to be broken, and then the next breakout may follow.
NVIDIA Price Pulls Back After Strong Rally
The share price for NVIDIA had risen to surpass the $230 level but saw selling pressure mount as the price fell back towards the $218 level. It implies that there is no more bullish pressure on the price now.
The technical indicators indicate that the buying pressure is still strong in the market. The RSI indicator for NVIDIA is currently trading at 57.98 compared to its previous value of 62.28. The RSI is showing cooling, but is still above the critical 50 level.

Source: TradingView
The Moving Average Convergence Divergence (MACD) is another technical analysis tool that confirms the bullish forecast regarding the price of NVIDIA. The MACD line is above the signal line, standing at 8.43 and 7.92, respectively. The histogram is also positive, at 0.50.
The above formation shows that there is still bullish momentum, but the gap between the two lines is narrowing. If more selling pressure is added to the market, the price of NVIDIA may fall again before making any attempt to rise.
Currently, all eyes are on whether NVIDIA’s price will be able to maintain its current support zone and build sufficient strength to make an attempt at breaking the $230 resistance zone.
This article contains market analysis and price predictions. These are not guarantees. Crypto markets are volatile. Always DYOR. Not financial advice.
Also Read | XRP Price Analysis: Will a Breakout Above $1.50 Trigger a Rally?