PENGU price is testing a descending trendline that has previously preceded double-digit rebounds, putting the meme coin’s next move under scrutiny as bearish pressure builds.
Table of Contents
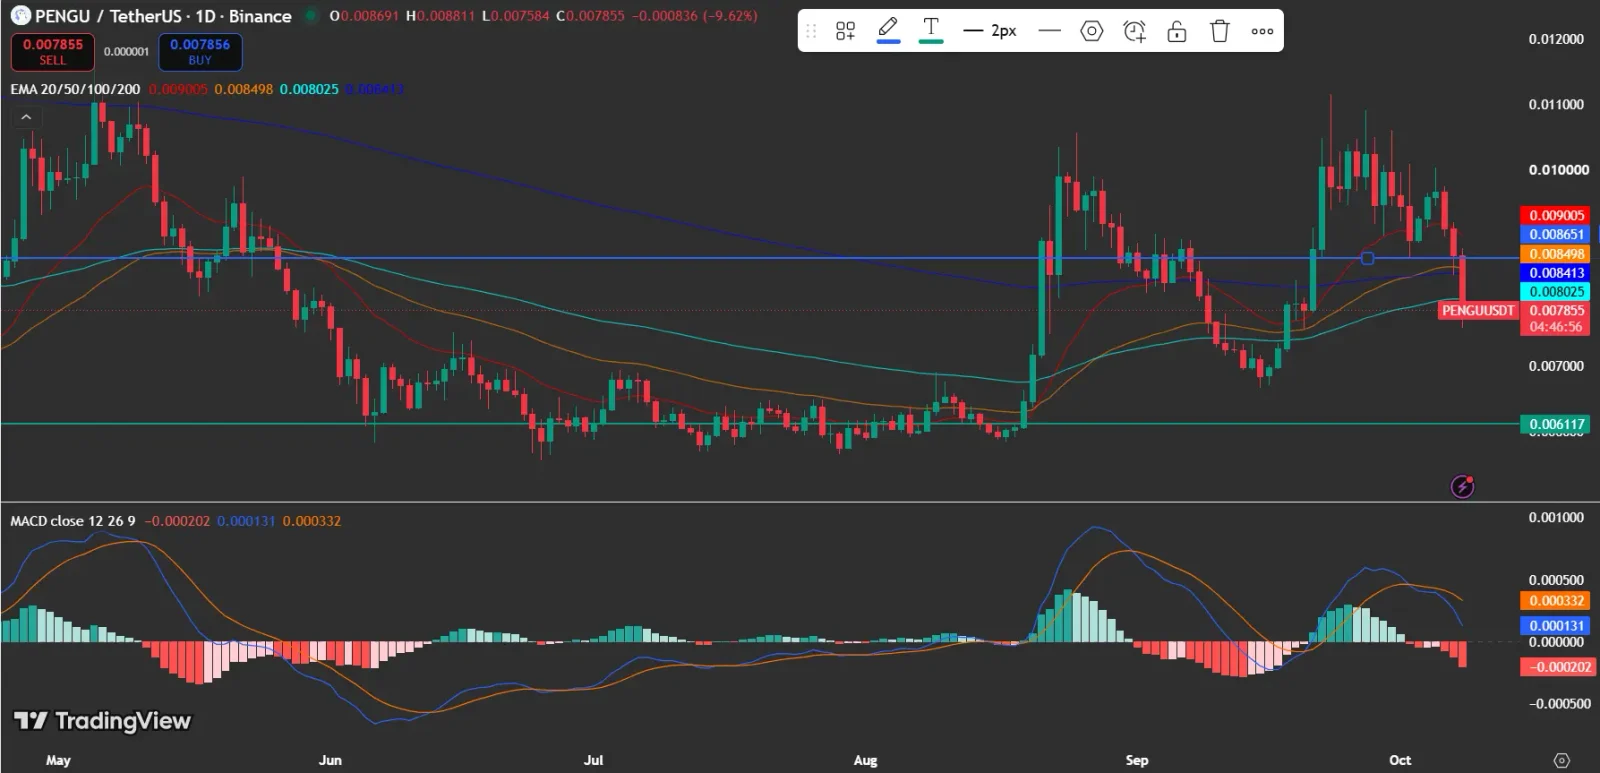
As of press time, PENGU traded at $0.007855, down 9.62% over the past 24 hours, according to the provided TradingView chart. Ali Charts noted on X that previous tests of the same trendline triggered rebounds of 13.17%, 15.62%, and 13.39%, raising the possibility of another recovery toward $0.0098 if the pattern repeats.
Also Read: Pudgy Penguins Price Eyes $0.01 After 46.6% August Gain
Why Is the PENGU Price Retesting a Critical Trendline?
According to Ali Charts, PENGU has repeatedly rebounded after testing a descending trendline over the past two weeks. Those earlier recoveries ranged from approximately 13% to 16%, making the current test a potential signal for traders watching for a shift in momentum.
“If history repeats, a similar rebound could take PENGU back toward $0.0098,” Ali Charts stated.
That target remains conditional, as the latest price decline and bearish momentum indicators suggest sellers currently have the upper hand.
Also Read: Pudgy Penguins (PENGU) Price Pulls Back After 53.6% August Surge
What Does the TradingView Chart Reveal About PENGU Price?
On the daily TradingView chart, PENGU is trading below all four of its key exponential moving averages (EMAs). The 20-day EMA stands at $0.009005, the 50-day EMA at $0.008498, the 100-day EMA at $0.008025, and the 200-day EMA at $0.008413.
With PENGU trading at $0.007855, all four averages remain above the current price. These levels could act as resistance during a recovery, with buyers needing to reclaim the moving averages to strengthen the bullish outlook.
Can the PENGU Price Climb Back Toward $0.0098?
The MACD indicator is flashing a bearish signal. Its histogram reads -0.000202, while the MACD line at 0.000131 sits below the signal line at 0.000332, indicating that bearish momentum is strengthening.
For a recovery to take shape, PENGU would first need to reclaim the $0.0081–$0.0085 area and sustain a move above it. Reaching $0.0098 would require additional buying pressure and a break above the moving averages.
From the current price of $0.007855, the $0.0098 target would represent a gain of approximately 24.8%, exceeding the three previous rebounds highlighted by Ali Charts.
Also Read: PENGU Price Forms Double Bottom as Analyst Sees 700% Upside
How Does CoinGlass Data Shape the PENGU Outlook?
According to the data from CoinGlass , PENGU’s open interest stood at roughly $150 million around October 8. Open interest measures the value of outstanding derivatives positions, helping traders assess the level of activity in futures markets.
The liquidation chart also shows a notable spike in long liquidations near the latest date, suggesting that leveraged bullish positions faced increased pressure. The chart alone does not establish whether further liquidations will follow or confirm the direction of future price movements.
What Should Traders Watch Next?
As PENGU attempts to stabilize, the $0.0081–$0.0085 range is an important recovery zone to watch. A sustained move above this area could support a rebound, while continued weakness would leave the token vulnerable to further declines.
The $0.0098 level remains a potential rebound target rather than a confirmed outcome. Traders should monitor price action around resistance, the MACD trend, and changes in open interest to assess whether buyers are regaining control.
Cryptocurrency markets remain highly volatile, and traders should monitor price action, market sentiment, and upcoming catalysts before making investment decisions.
Also Read: PENGU Price Analysis: Triangle Setup Points to Potential $0.0080 Rally
This article contains market analysis and price predictions. These are not guarantees. Crypto markets are volatile. Always DYOR. Not financial advice.