
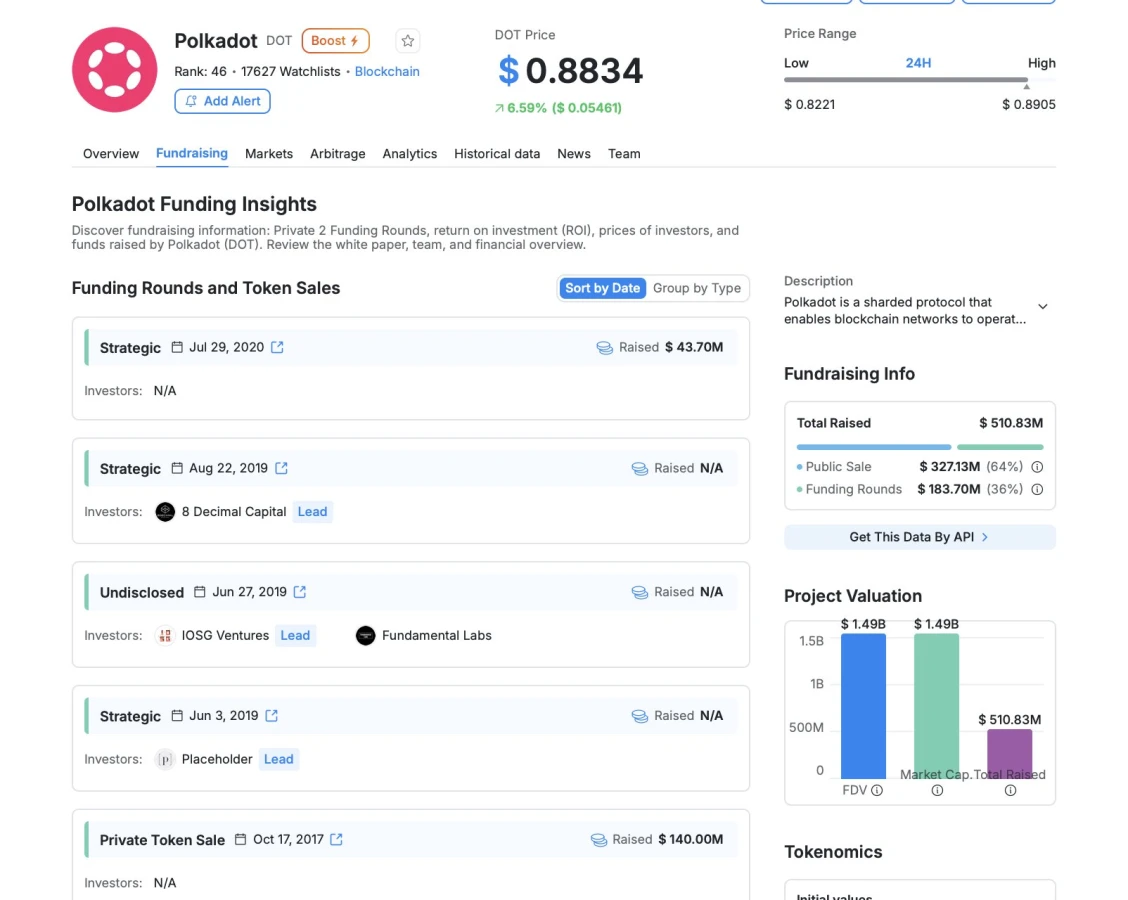
Polkadot, created by Ethereum co-founder Gavin Wood, once stood among the most heavily financed blockchain projects. During the period between 2017 to 2020, the project was able to generate revenues of approximately $510.8 million through public and private funding efforts.
Some of the key cryptocurrency funders included Polychain Capital and Pantera Capital. The token offering in October 2017 alone raised revenues of approximately $145 million in two weeks’ time, as per analyst Crypto Patel.
Also Read: Dogecoin Price Prediction: Experts See 200% Rally After Major Bottom Signal
Early Setbacks Shaped the Journey
The project suffered an initial setback when a bug in the multisignature wallet software of Parity froze around $98 million worth of the funds raised during the ICO process. Regardless of that setback, the development went on until the release of Polkadot mainnet in May 2020 and the growth of DOT to close to $55 in November 2021.
Bear Market Leaves DOT Near Record Lows
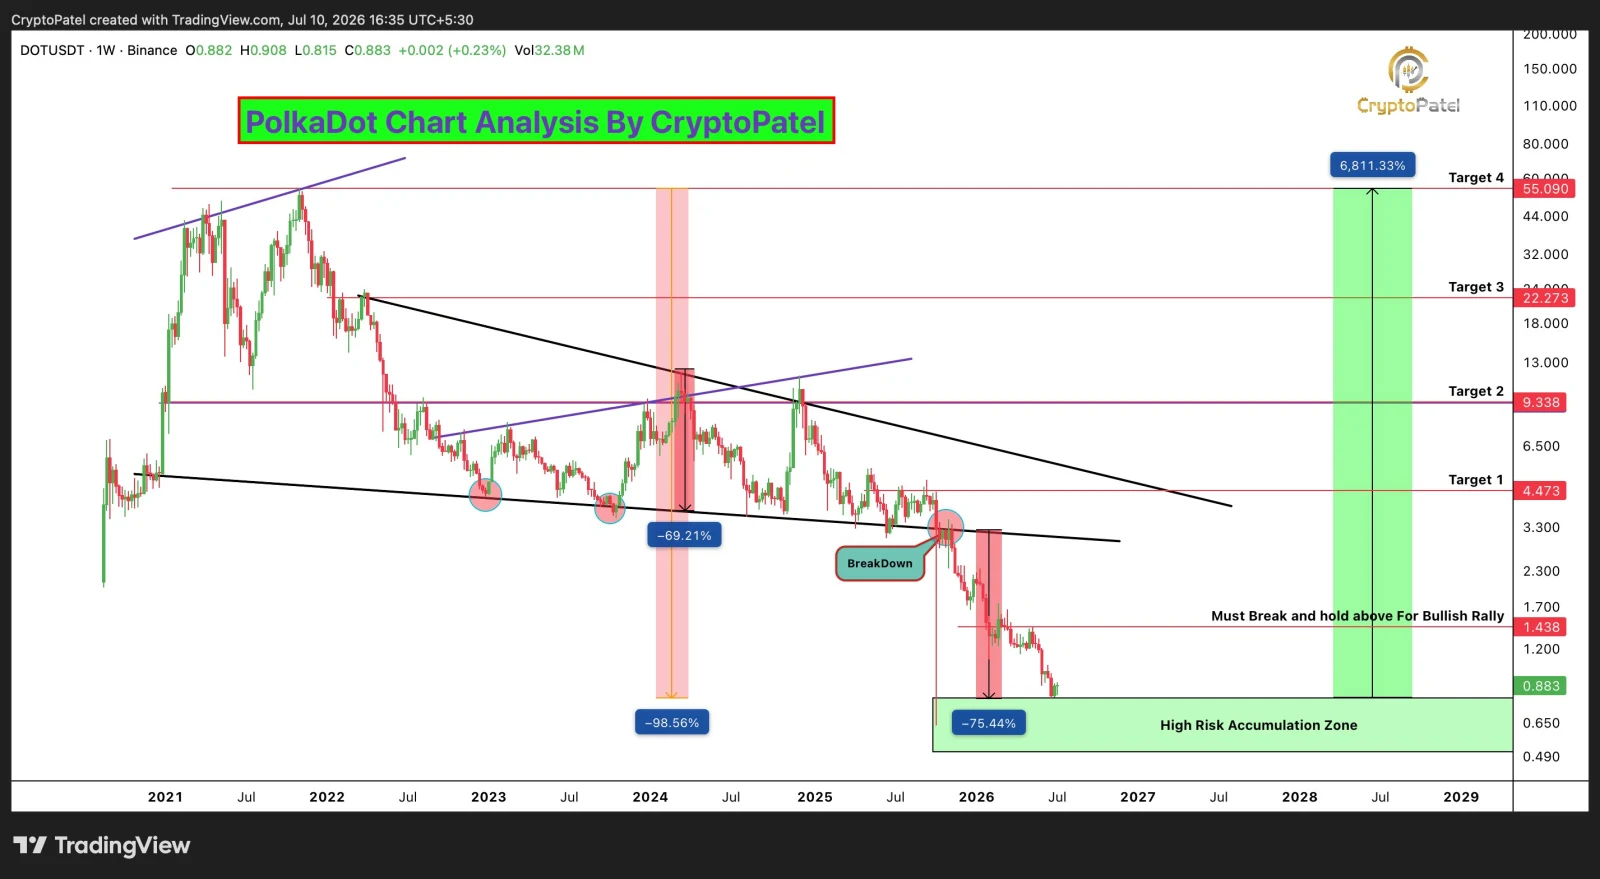
Several years of high inflation rate and consistent market decline took the token close to the $0.87 mark, with its lowest price point being approximately $0.80 in June 2026. The supply restriction was established when the token was down by quite a lot.
Technical analysis indicates a lengthy declining trend with consistently lower highs and lower lows. For nearly three years, the price range was controlled by the descending triangle formation and finally collapsed to the downside, resulting in a 75% decline.
Key Levels Could Define the Next Phase
This area is considered to be bullish on the basis of the price increase expected in the future by analysts. However, as long as the confirmation of reversal has not taken place, the risk remains high.
The first level of resistance is at approximately $1.44; remaining above it for some time would help reverse the existing downtrend. Resistance exists at $4.47, $9.34, and many more.
Polkadot Short-Term Charts Offer a Brighter View
However, not all are pessimistic. According to market expert Ozen, the basic strength of DOT remains intact. Over the short term, the DOT/ETH market cap chart continues to exhibit new highs and lows following the breakout that occurred at the end of June. The recent decline appears to be driven by profit-taking, rather than selling pressure.
A rise in demand for Polkadot around the prior resistance level can trigger some momentum to test the prior highs. However, at the moment, Polkadot demonstrates a contrast between strong fundamentals and the market looking for confirmation of recovery.

Also Read: TRON Price Eyes $0.3664 Target as the Network Revenue Hits New Milestone
This article contains market analysis and price predictions. These are not guarantees. Crypto markets are volatile. Always DYOR. Not financial advice.
