Quant (QNT) rallied as The Clearing House picked Quant to assist with a tokenized commercial bank deposit network. The agreement placed Quant at the center of infrastructure linking digital deposits with established payment systems across markets.
Table of Contents
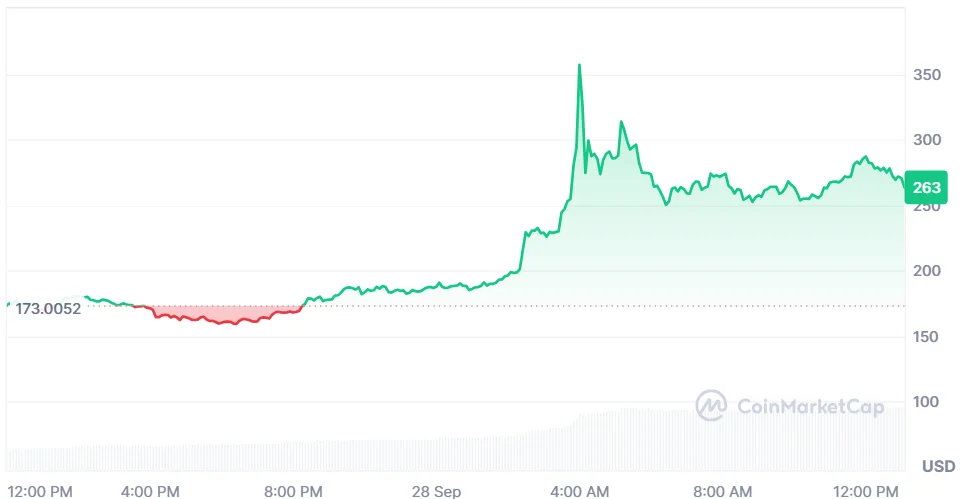
The announcement is the primary trigger for this week’s dramatic rise in the price of Quant (QNT). At press time, QNT trades at $263.32, up 53.1% in 24 hours and 299.64% in a week, according to CoinMarketCap.
Trading volume climbed 165.6% to $1.25 billion. The increase came as market attention grew around Quant’s role in tokenized banking infrastructure and the network’s planned launch.
Also Read: ONDO Price Eyes Breakout as RWA Growth Strengthens Market Outlook
What Is Driving the QNT Price Rally?
The Clearing House has partnered with Quant to develop infrastructure for its On-Chain Money Initiative. The network will focus on clearing and settling tokenized commercial bank deposits on-chain.
It will also facilitate interoperability, transaction monitoring, and connections with existing payment systems. They encompass links to the Real-Time Payments network as well as the Clearing House Interbank Payments System, or CHIPS.
According to the Clearing House, the network should be accessible to the participating institutions by the first half of 2027. The timeline provides a clear roadmap for banks to integrate tokenized deposits into current payment systems.
The US payments company processes more than $2 trillion every day. It extends its networks to wire transfers, automated clearinghouse payments, check images, and real-time transactions.
Who Is Behind the Tokenized Deposit Network?
Quant will offer technology for the new banking network, and The Clearing House will bridge the system with the existing architecture in the financial sector. The project aims to facilitate money in a form tokenized by a commercial bank while keeping deposits within regulated banking.
Quant CEO Gilbert Verdian described the selection as an important step for programmable money. Tokenized deposits might streamline the process of transferring money on-chain without necessarily exiting the regulated banking system, he said.
The effort is coming as Britain also pursues an independent development. Major banks there conducted actual transactions with customers with sterling deposits tokenized.
That development fits into the context of the project, as financial services institutions experiment with blockchain as tools for settlement. It also sheds light on the increased focus on the QNT price after its announcement.
Where Are Analysts Watching QNT Price Levels?
Popular analyst Egrag Crypto highlighted that QNT had spent almost 1,700 days building a large macro range. He tagged $50 and $55 as the macro support area and $70-$75 as lower support.
The analyst marked the mid-range pivot in the $110 to $120 range and marked the macro range high at $165 and $175. During the current rally, QNT has passed above that higher level and the analyst’s estimate of $227.
The token is currently trading near $263 and is now within Egrag’s fair value zone of $230 to $270. The recent move has resulted in a shift in focus from the zone to breaking the old $165-$175 zone and maintaining the price above.
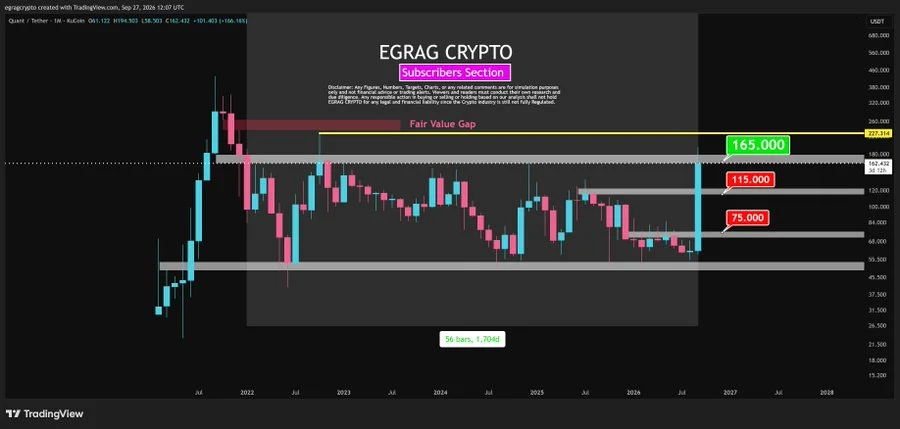
If it bounces down below that area, then there will be a retest of the $115-120 price zone. Any weakness might see a move down to the $70 and $75 support area.
The analyst also highlighted the significance of the monthly close. A persistent close above the prior range will give a different sign than a quick breakdown and then closing back inside the range.
When Could QNT Consolidate After the Breakout?
Furthermore, another analyst, Crypto Patel, also mentioned the extent of the latest move, following the clearance of higher timeframe resistance around $115. According to the analyst, QNT had surged by 252% in one week following the prior breakout setup.
The first projected levels at $150 and $180 were reached during the advance. However, Patel noted he would not “chase” to get in on an entry margin here after a sharp jump.
After a parabolic boost, the consolidation or a retracement becomes important, he said. If the market begins construction on the next big block, the $100 to $50 range may come into play.
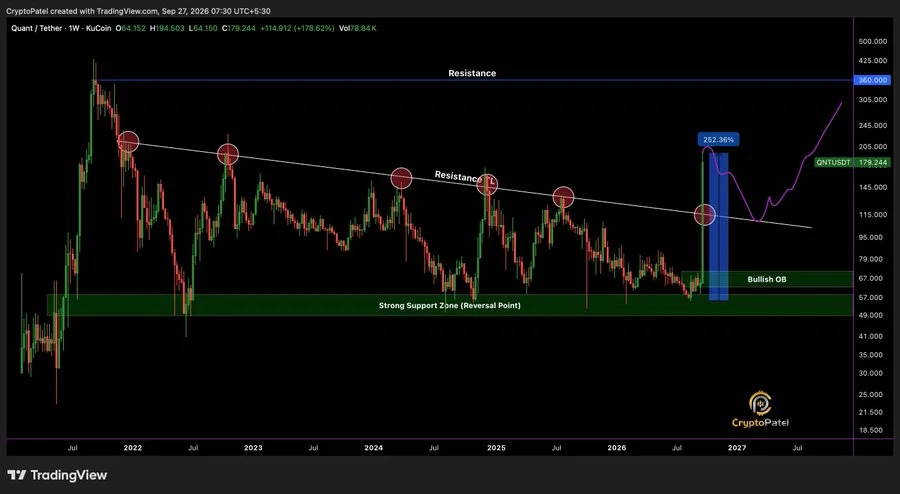
If strong support holds above $100, then $300 will remain as a next big expansion level, Patel added. That view keeps the QNT price outlook tied to whether recent gains can hold after the surge.
Why Do Derivatives and Indicators Matter for QNT Price?
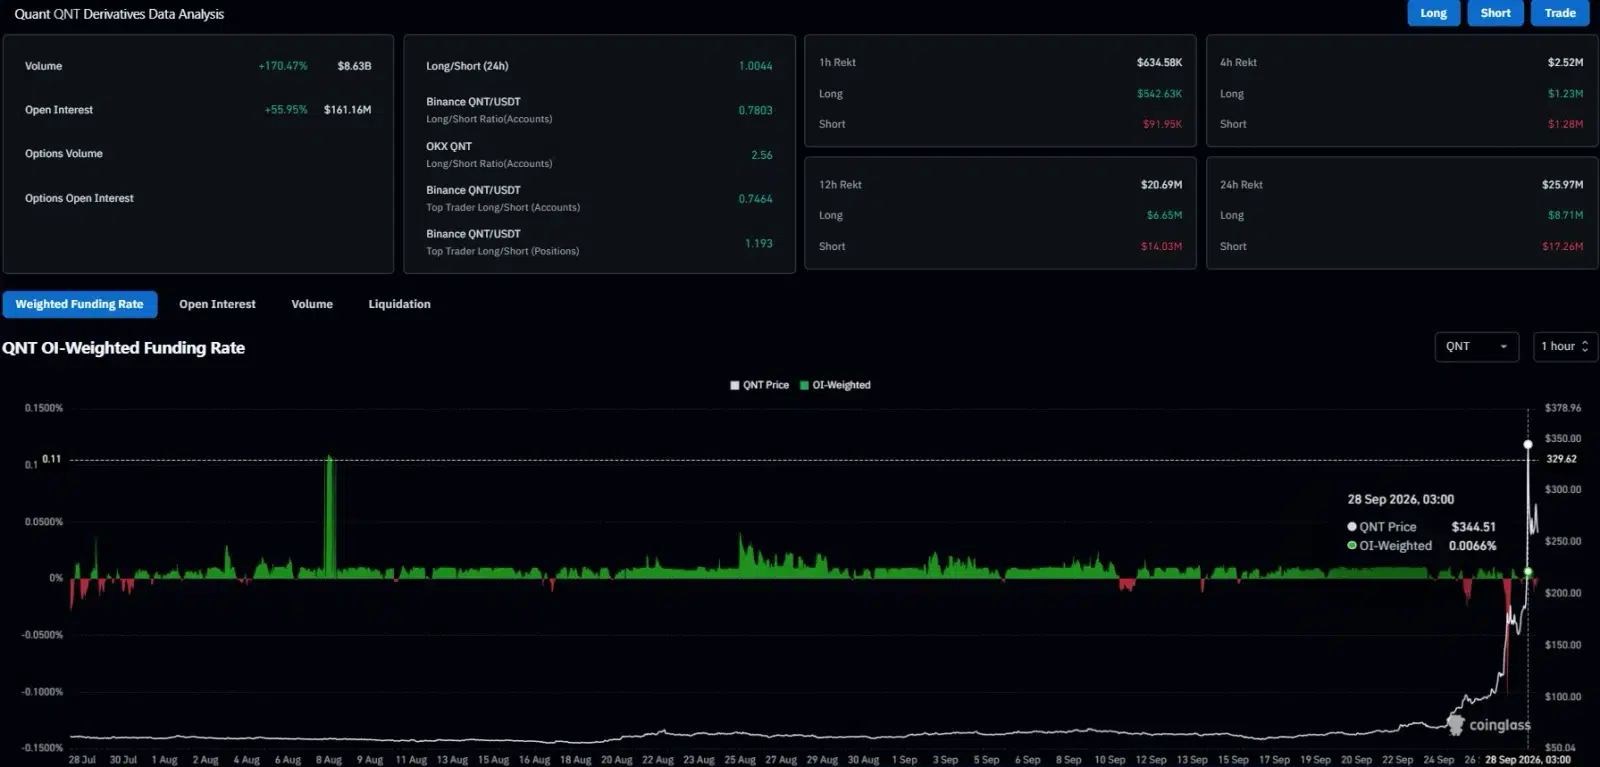
CoinGlass data showed derivatives volume rising 170.47% to $8.63 billion. Open interest increased 55.95% to $161.16 million, while the QNT open interest-weighted funding rate stood at 0.0066%.
The increase in volume and open interest shows that more capital entered QNT derivatives during the rally. The positive funding rate also indicates that long positions were paying short positions in perpetual futures.
According to TradingView data, QNT sustained its bullish trend on key exponential moving averages (EMAs). The 20-day EMA is positioned at $113.73, while the 50-day EMA stands at $85.44.
The longer-term indicators were also significantly below the market price. The 100-day EMA is recorded at $75.76, while the 200-day EMA stands at $73.36.
QNT remained trading above all four EMAs. The positioning revealed that the token was still well above both short, medium, and long moving average trend benchmarks.
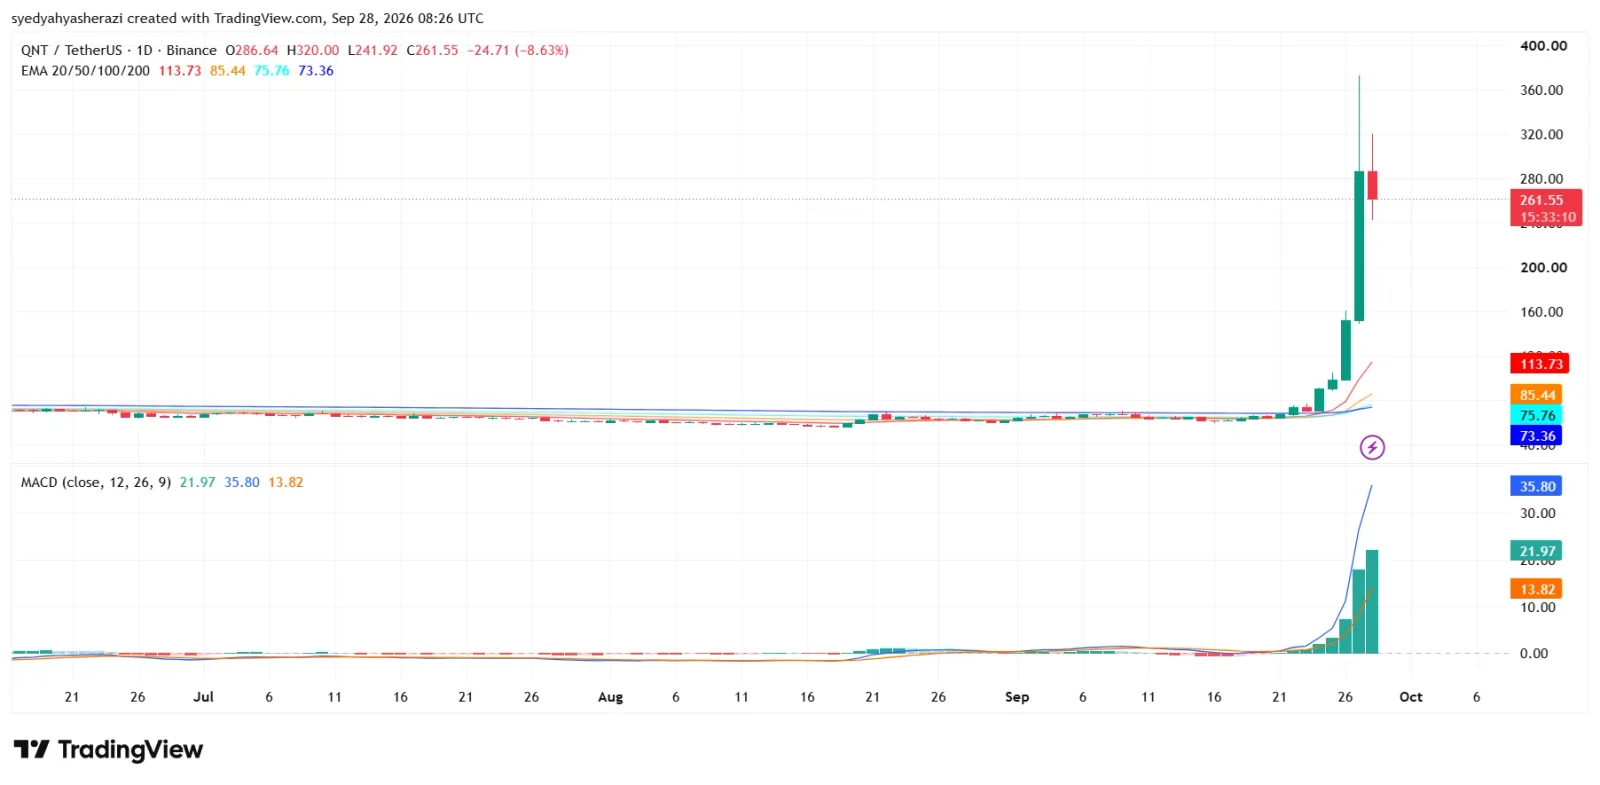
The Moving Average Convergence Divergence (MACD) remained in the positive zone. The MACD line is positioned at 35.80, significantly above the signal line at 13.82, while the histogram is also positive at 21.97.
Also Read: California Crypto Law Bans Public Officials From Issuing Memecoins
This article contains market analysis and price predictions. These are not guarantees. Crypto markets are volatile. Always DYOR. Not financial advice.