
Shiba Inu (SHIB) breakout from a falling wedge pattern signals potential bullish momentum for the SHIB price, supported by improving RSI and MACD indicators. However, declining open interest and trading volume suggest traders remain cautious despite expectations of a possible strong rally ahead. According to CoinMarketCap, SHIB is trading at $0.000006437 with a daily gain of 2.49%.
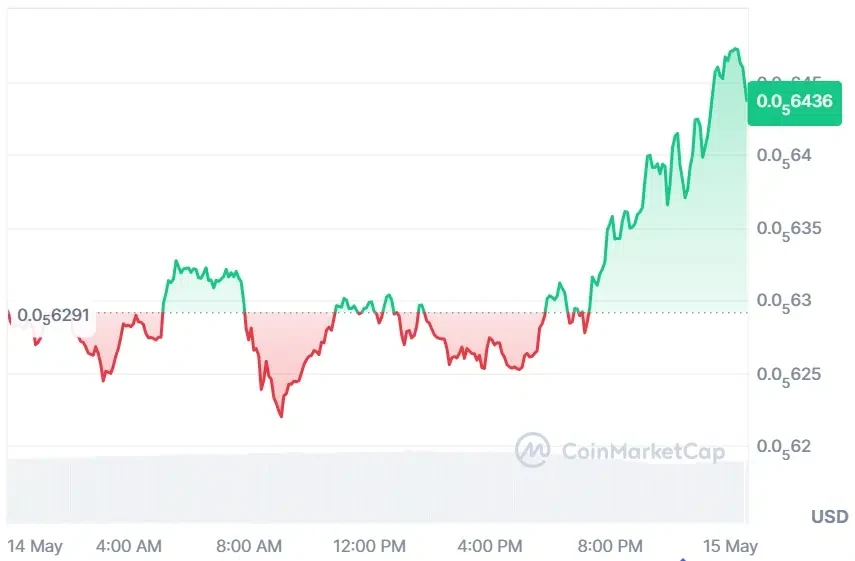
Source: CoinMarketCap
SHIB Derivative Data Points to Reducing Potential
According to Coinglass, the SHIB open interest declined by 8.82%, bringing the total to $59.96 million. The reduction in open positions suggests that traders are closing contracts or reducing exposure, reflecting weaker confidence and a more cautious approach toward maintaining positions in the current market environment.
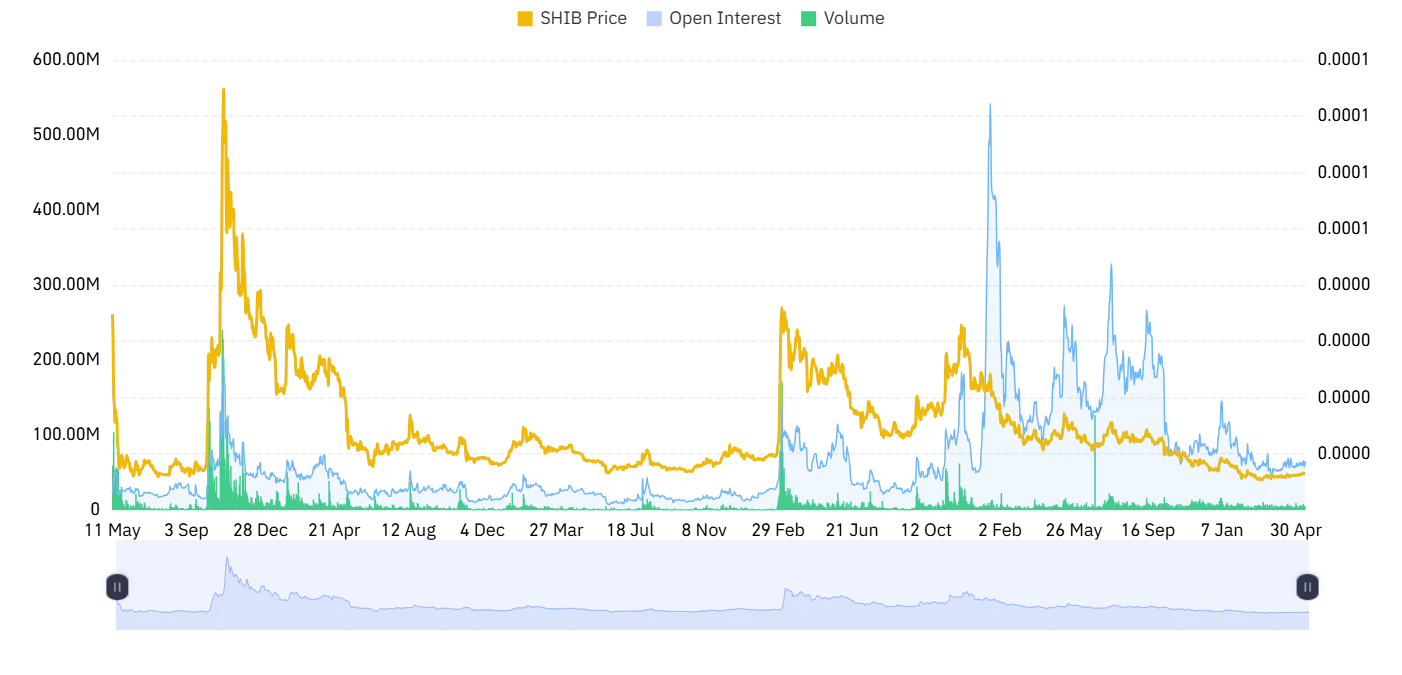
Source: Coinglass
Trading volume also dropped by 17.13%, reaching $120.47 million. The decline in overall market activity indicates lower participation from investors and traders, which may signal slowing momentum and reduced enthusiasm.
Also Read: Shiba Inu (SHIB) Price Analysis: Falling Wedge Pattern Signals Potential Breakout
SHIB Price Breakout Signals Massive 6X Rally
Furthermore, the crypto analyst Javon Marks highlighted that the SHIB price is receiving another wave of bullish attention after escaping the confines of a falling wedge pattern, which is an indicator that usually marks a reversal in the crypto market.
The escape from the falling wedge pattern, according to experts, suggests that buying momentum is gaining traction amid reduced selling pressure.
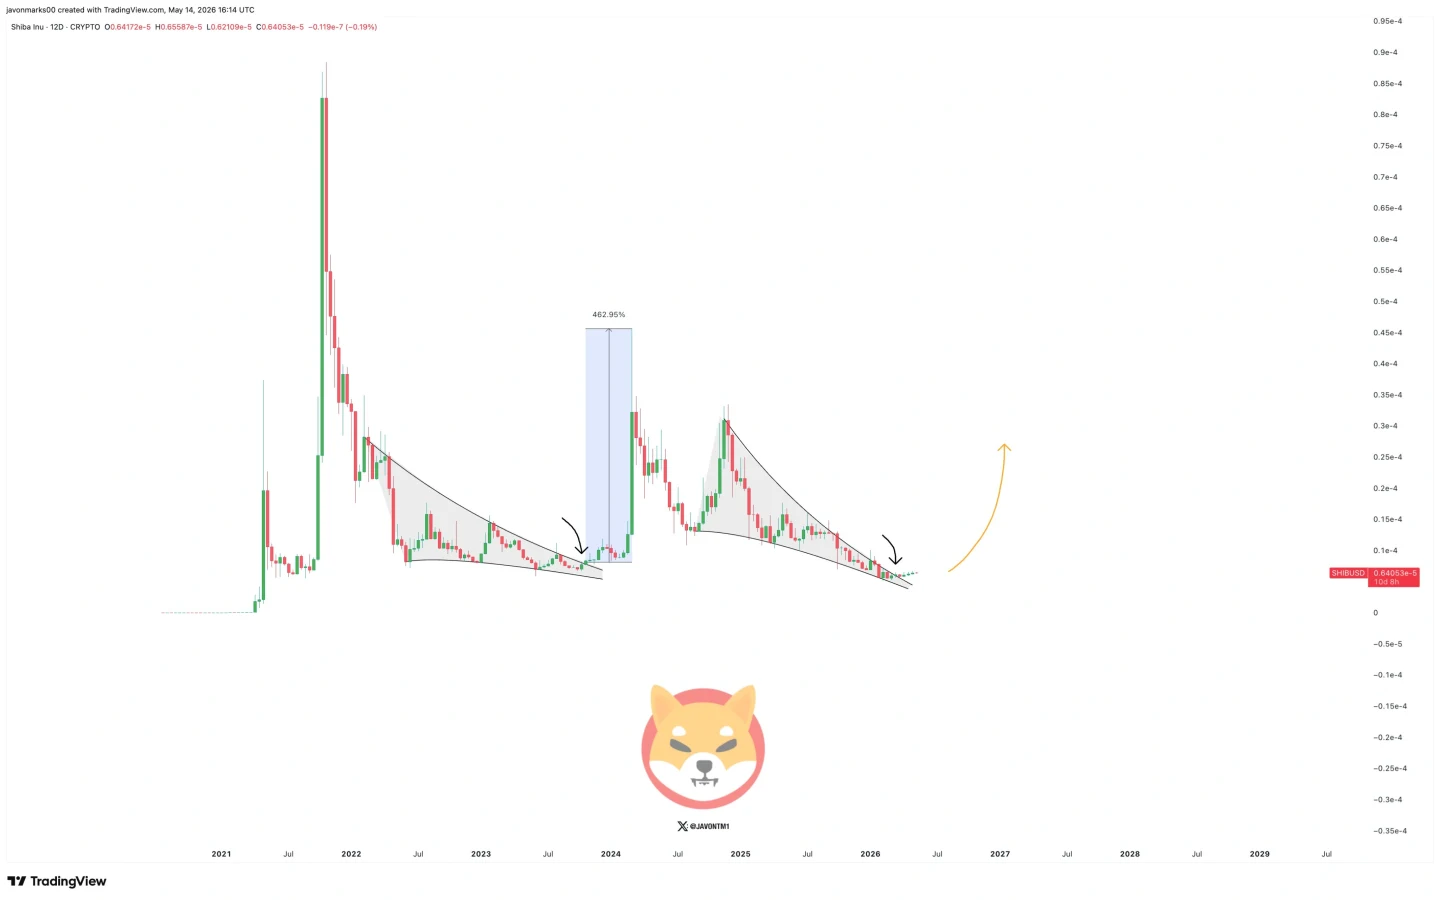
Source: Javon Marks’ X Post
The latest occurrence in a similar trend witnessed a blowout move that increased the SHIB price by about 6x and reached its peak at around $0.000030.
However, the current market trend seems to suggest that an even greater move for the SHIB price might occur, as an alt season is expected to arrive soon, and SHIB will benefit from the new influx of investors, trading volumes, and momentum.
Momentum Indicators Support Upward Potential
According to TradingView, the RSI has swung to neutral momentum with an RSI value of 52.94. Consistent movement above the signal line indicates an increasing trend of buyers’ momentum after a long period of decline.
The SHIB price has managed to lose its oversold condition, suggesting that the previous bearish sentiment has started to stabilize.
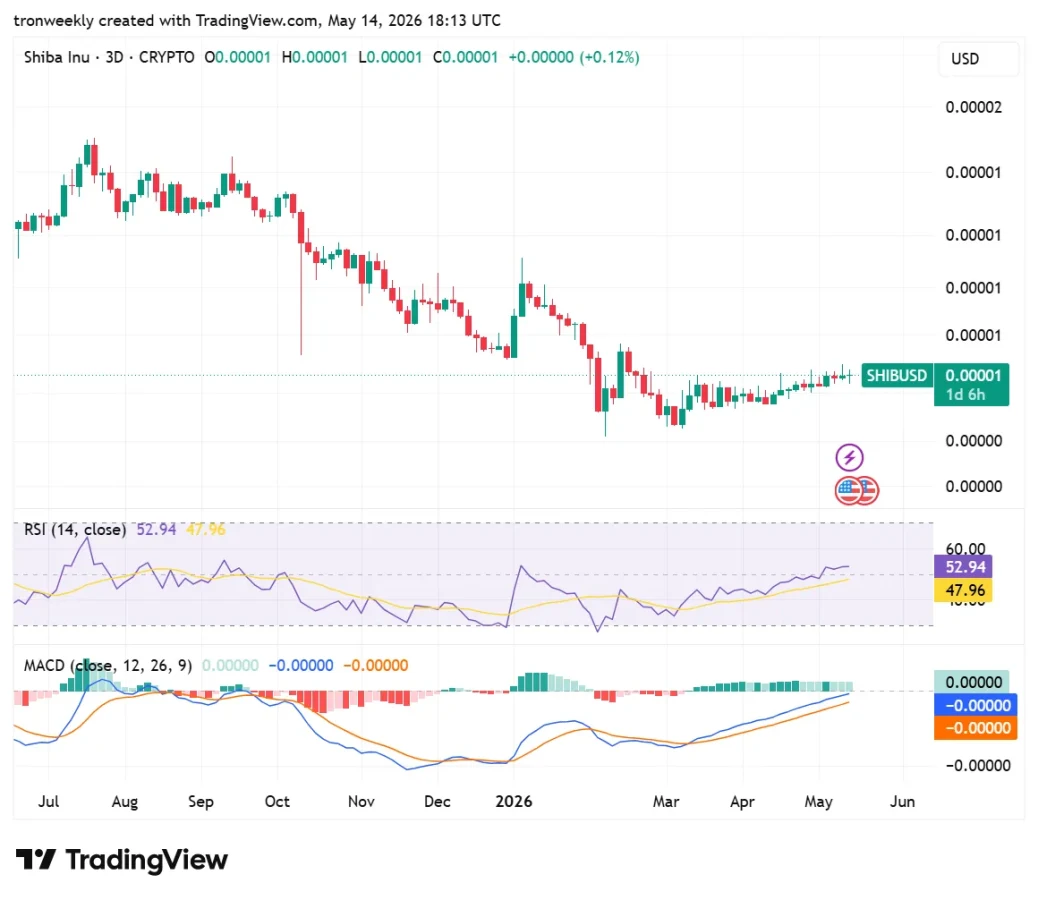
Source: TradingView
The MACD indicator confirms the recovery trend by displaying a series of increasing histogram bars colored green. Both the MACD and signal lines rise towards the zero point, indicating that there is an accumulation of positive momentum.
This scenario suggests that the market is exiting its extended bearish trend into a period of consolidation or recovery.
This article contains market analysis and price predictions. These are not guarantees. Crypto markets are volatile. Always DYOR. Not financial advice.
Also Read: SHIB Price Ascending Triangle Signals Rally Toward $0.00000760 Resistance Ahead