Solana processed 557 million stablecoin transfers in September, marking a 33% increase from August and averaging 18.6 million transfers daily. The growth highlights rising network activity as traders monitor SOL’s technical structure. Crypto analyst Solana Hub identified an ascending triangle on the SOL price chart, pointing to higher lows and a key resistance level. The analyst also raised the possibility of SOL reaching $1,000, although that target depends on a confirmed breakout, sustained buying pressure, and broader cryptocurrency market conditions.
Table of Contents
Solana Records 557 Million Stablecoin Transfers
Solana reported 557 million stablecoin transfers in September, representing a 33% increase compared with August. This equals approximately 18.6 million transfers per day, highlighting the scale of stablecoin activity across the network.
Stablecoins support payments, trading, decentralized finance applications, and liquidity movement across blockchain networks. Rising transfer counts can indicate increased usage, although they do not necessarily confirm higher transaction values or growth in unique users.
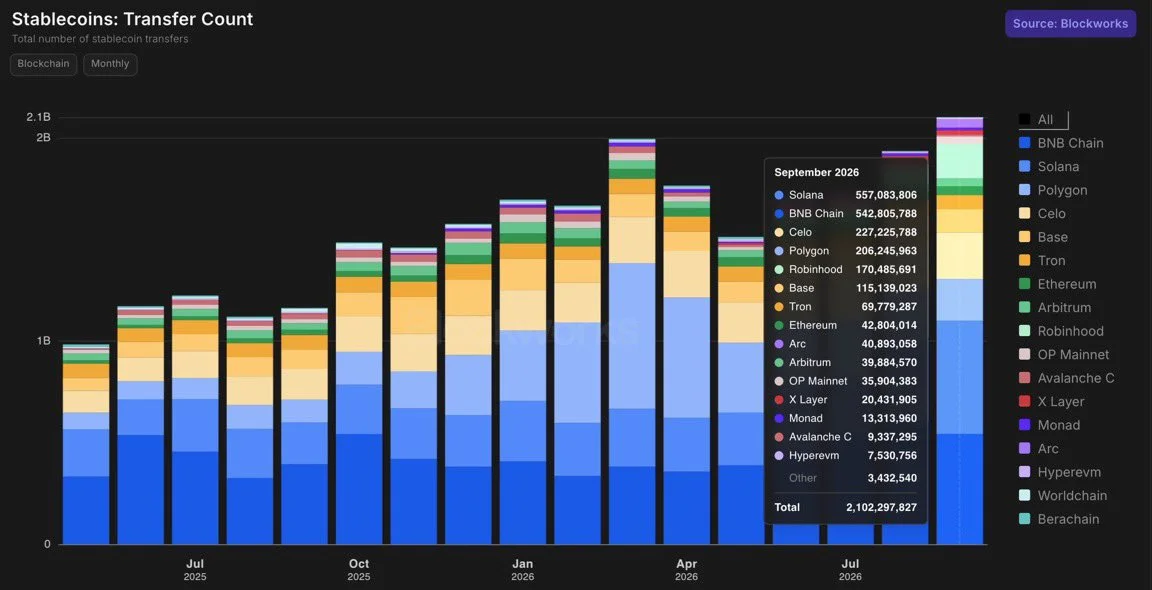
Source: Solana’s X Post
These figures will serve as added information regarding Solana’s ecosystem growth. Data regarding the supply of stablecoins, transactions value, active addresses, and decentralized exchange trading would have served as additional information in this regard.
Also Read: Solana Mobile Partners With Ledger as SOL Price Eyes $378 Breakout
Stablecoin Activity Strengthens Solana’s Network Outlook
An increase in transfers shows the involvement of Solana in blockchain-based payments and finance solutions. Stablecoins enable users to transfer dollar-based assets through trading platforms and DApps.
The further increase in adoption can lead to the strengthening of the stablecoins in the Solana blockchain. However, network adoption does not always mean increased demand for SOL coins. The coin’s price is also dependent on market liquidity and overall crypto market trends.
The traders can use the growth of stablecoins transfers against the SOL trading volume and other on-chain data to determine whether increased network activity goes together with higher demand in the market.
SOL Price Ascending Triangle Signals Potential Breakout
The Solana Hub, an analysis platform for cryptocurrencies, spotted an ascending triangle formation on the price chart of SOL.
An ascending triangle usually occurs where buyers buy at increasingly higher prices and sellers hold out at the same resistance area. A break above the said resistance would likely result in a bullish breakout if buyers sustain their pressure.
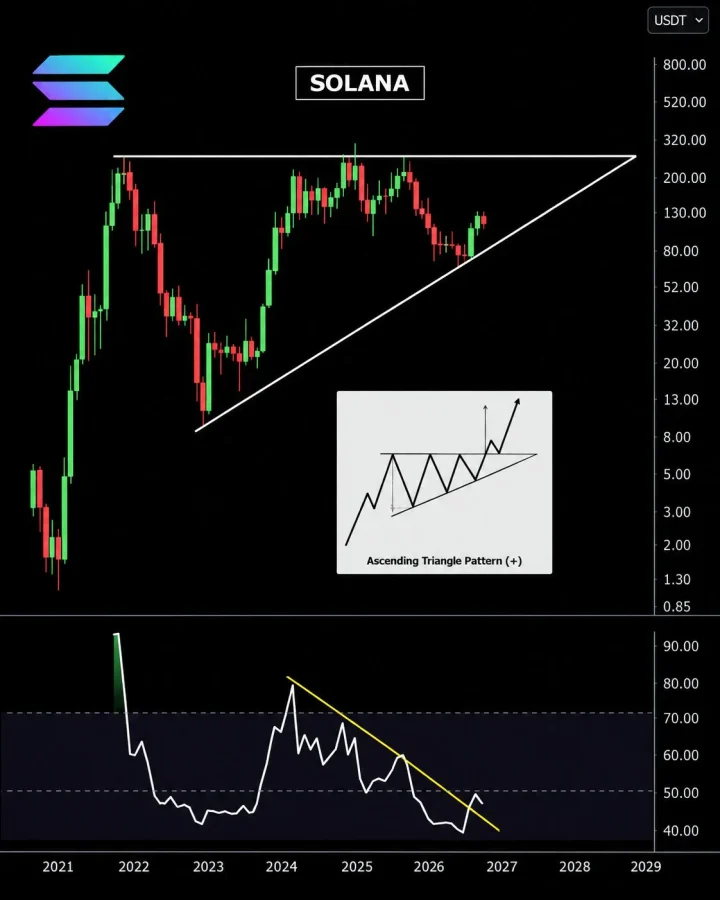
Source: Solana Hub’s X Post
The analyst also cited improving momentum based on RSI signals. However, the Relative Strength Index is quite volatile, and breakout signals do not assure that there will be more gains ahead.
A consistent breakout beyond resistance coupled with increased volume would reinforce the bullish sentiment. Failing to break the resistance could see SOL confined in the pattern or move lower towards support levels.
The analysis provided does not give the current SOL price, resistance level, and RSI level, making it difficult to set accurate technical targets.
Analyst Raises $1,000 SOL Price Possibility
Solana Hub stated that the price of SOL could be setting up for an important breakout since the ascending triangle has completed the pattern. There is even the likelihood that the coin would reach $1,000.
However, this is an assumption as opposed to a prediction. This requires prices to have moved considerably and consistent demand from the market. The pattern in itself does not determine the possibility and time of occurrence of such an event.
It is important for investors to take into consideration the market capitalization of SOL, liquidity of the network, and cryptocurrency market conditions.
What Comes Next for SOL?
The next big step for SOL will be influenced to some extent by the ability of buyers to break through the resistance seen by Solana Hub. A successful breakout will add to the positive bias, while failure will dampen the positive bias.
Growth in the amount of stablecoin transactions, increased liquidity, and decentralized application usage can provide more signs of ecosystem growth.
As things stand, the transaction figures recorded in September by Solana serve to demonstrate the level of network activity, whereas the ascending triangle serves to present the technical trigger. Reaching the $1,000 level is still quite optimistic, especially because SOL’s direction will depend on various factors.
Also Read: Solana Posts $299M App Revenue as SOL Price Outlook Draws Attention
This article contains market analysis and price predictions. These are not guarantees. Crypto markets are volatile. Always DYOR. Not financial advice.