Solana price remained in focus on Wednesday, September 23, 2026, as traders assessed renewed ETF demand, strong technical momentum, and nearby liquidation zones following the token’s sharp weekly recovery move.
Table of Contents
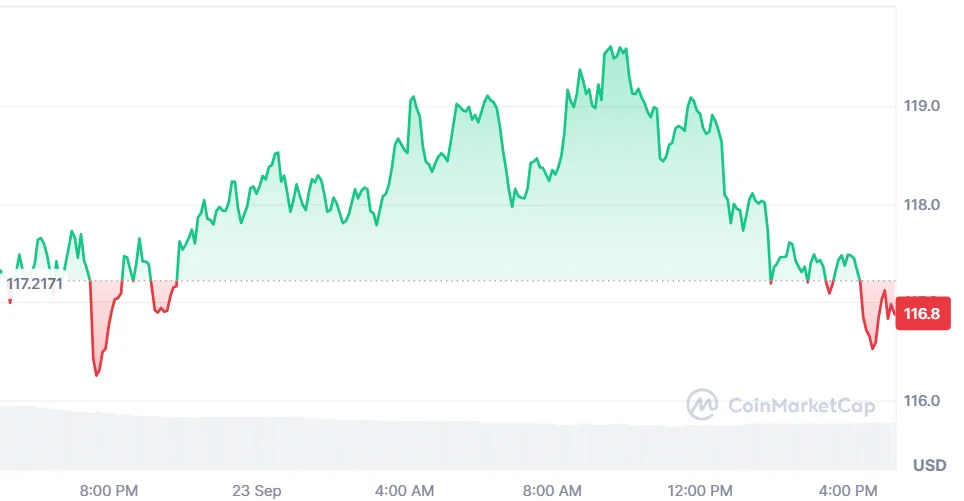
As of press time, Solana (SOL) is trading at $116.87, showing a decline of 0.16% in a day. The 24-hour trading volume is standing at $4.5 billion, with a market capitalization of $68.66 billion. Over the last week, the SOL coin price has increased by 19.64%, according to CoinMarketCap.
Also Read: Solana Flip Ethereum 2026: Explosive Bullish Flip Ahead?
Where Solana Price Could Head After Its Strong Rally
Popular analyst Crypto Patel highlighted that SOL has already rallied over 100% to double above his previous accumulation range of $60-$67. Specifically, SOL appreciated from $60-$67 to $120, a rise of more than 100%.
Patel forecasted SOL’s fall below $70 down towards $50 in the medium term, even as he retained a highly optimistic long-term outlook. He said $500-$1,000 target potential is still intact despite the recent rally.
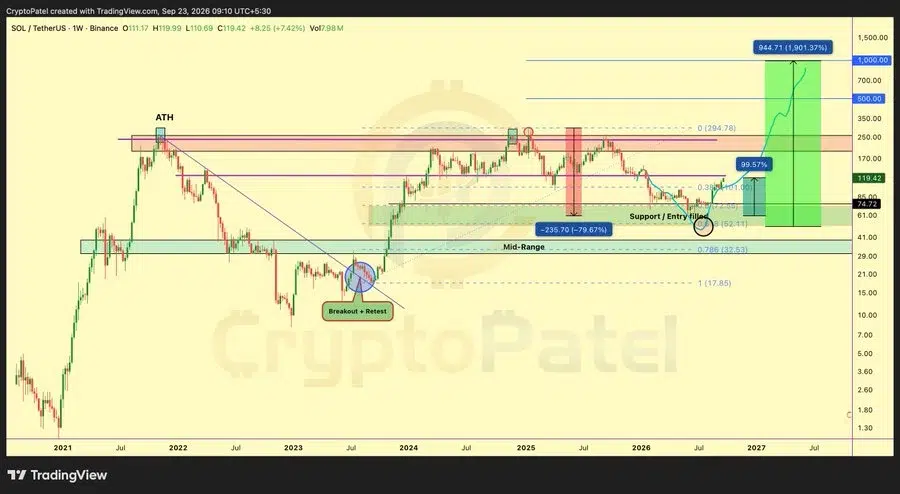
The analyst reported SOL briefly breached $120 in its ongoing correction before retreating to $116.87. Traders that had accumulated within the $60-$67 level would be sitting on profits. Patel added that he has not changed his longer-term targets despite the latest pullback.
How RSI Shapes Solana Price Outlook
Redlion, another analyst, mentioned that SOL has regained its relevance since taking back the $110 region. According to him, the setup has a constructive structure as buyers defend the breakout level. He marks the critical support level at $110-$111.
The first major resistance level sits at $119-$121. A clean move above $121 could expose $123 or higher. Any move below $110 will render the immediate outlook bearish.
The analyst pointed to the daily RSI indicator hovering around 70. He remarked that the level suggests that SOL is getting overstretched following the latest rally wave. He expects SOL to consolidate ahead of its next move.
Why Solana ETF Inflows Are Gaining Attention
According to SoSoValue data, on September 22, the Solana spot ETF saw net inflows of $28.87 million, raising total cumulative net inflows to $1.47 billion. Total net asset value stood at $1.77 billion.
This increase follows net inflows of $47.62 million and $26.10 million on September 18 and 21, respectively, marking robust demand recovery following relatively weaker sessions earlier in September.
Trading activity is also robust over these sessions. The ETF trade value rose to $93.96 million on September 22 from $142.79 million on September 21, while a higher value of $199.56 million is recorded on September 18.
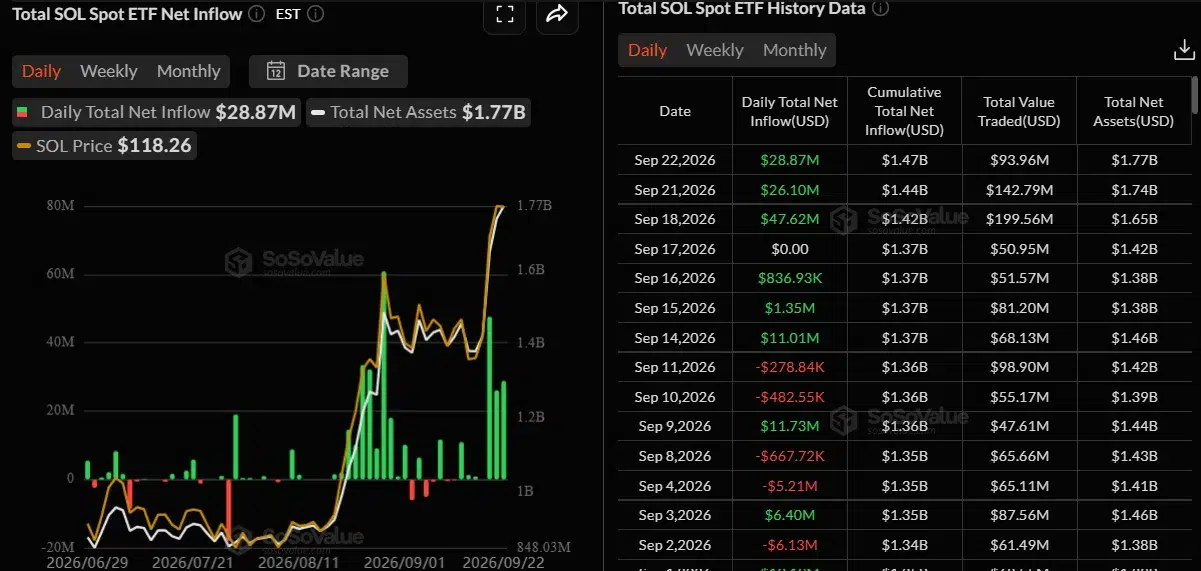
Solana’s trading price stood at $118.26 at the September 22 ETF session. All three sessions exhibited positive net flows. Further sessions may determine whether the flow trend persists.
Where SOL Faces Support and Liquidation Pressure
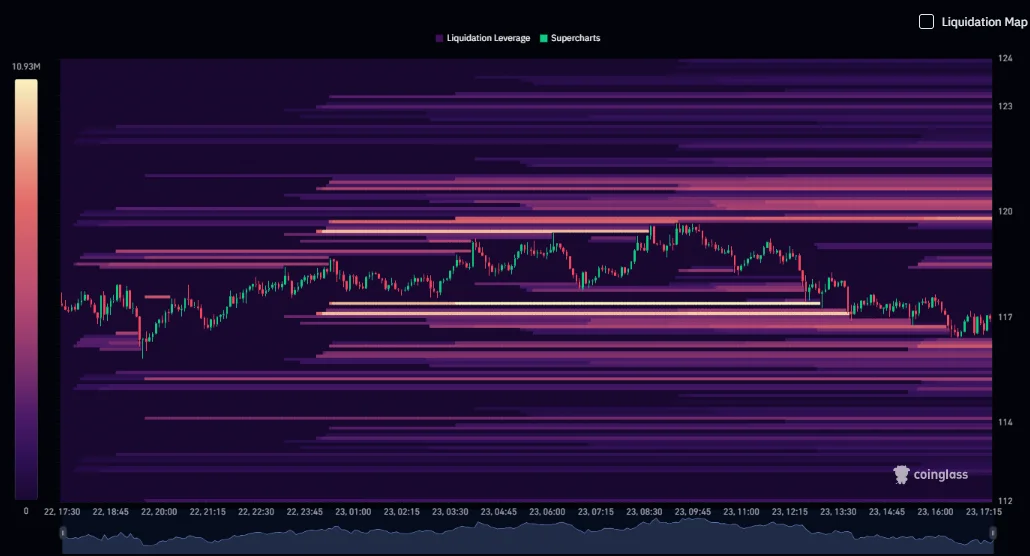
According to CoinGlass liquidation heatmap data, the dense liquidity cluster is evident within a narrow price range of $116.8-$117.3, which aligns closely with the prevailing market rate. A bearish breakout would expose liquidity pressure near $115-$116.
High liquidations appeared in the overhead range of $119.5-$120.2, constituting the primary overhead resistance zone according to the heatmap. Breaking above $120 may spark liquidations towards $121-$123.
However, derivatives trading activity slowed simultaneously. According to CoinGlass data, futures trading volume declined by 19.11% to $9.78 billion. Open interest reduced by 1.41% to $7.13 billion. The OI-weighted funding rate is recorded at 0.0006%.
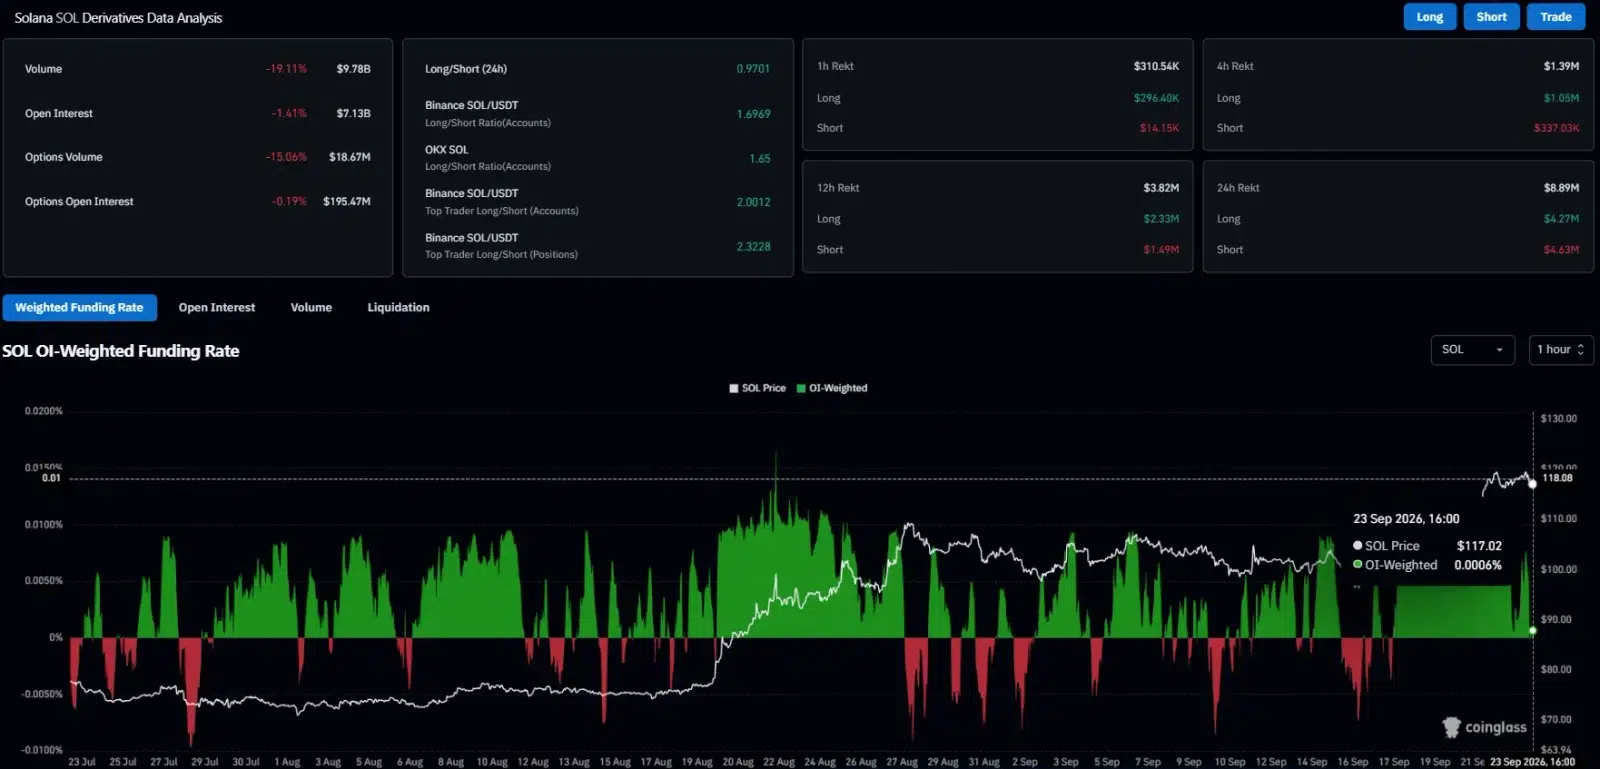
Futures volume and open interest fell below their previous readings. Nevertheless, funding is modestly positive notwithstanding the declines. The data reflect prevailing derivative conditions but do not determine the next direction.
What EMA and MACD Signals for Solana Price
According to TradingView data, the 20-day Exponential Moving Average (EMA) stands at $106.76. The 50-day EMA comes in at $97.82. At present, the Solana price hovers slightly above these short-term moving averages around $117.09.
At current levels, Solana’s 100-day EMA sits at $91.22. Similarly, its 200-day EMA stands at $93.37. Solana price continues to trade well above these medium-term moving averages as well.
The Moving Average Convergence Divergence (MACD) line currently sits at 5.49. Meanwhile, its signal line stands at 4.31. Additionally, the MACD histogram stands positively at 1.19. The readings showed positive momentum on the chart.
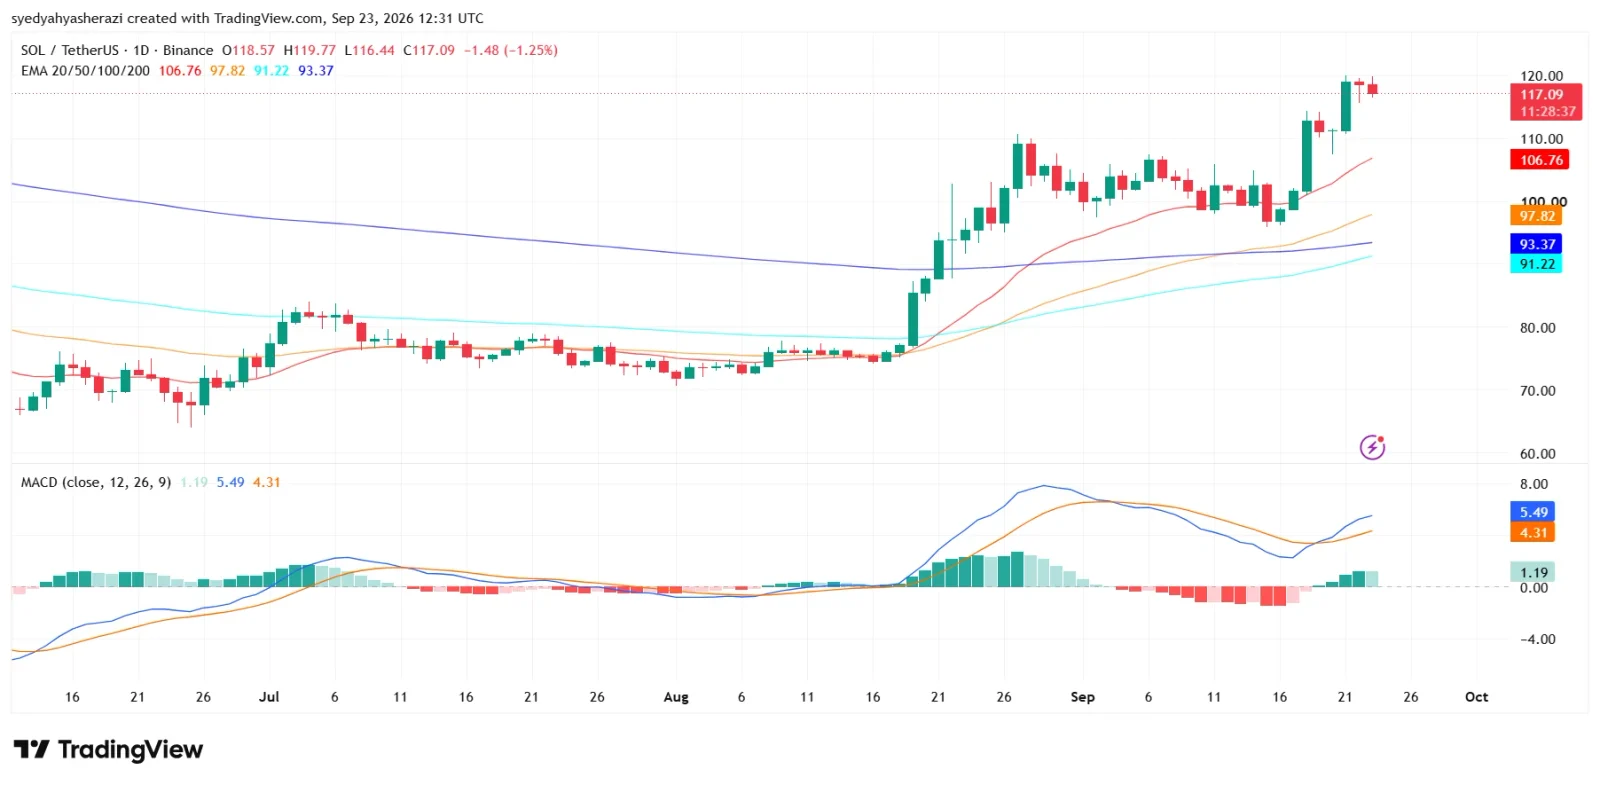
Solana price action continues to play out amidst key support and resistance zones. Increased ETF flows, along with decreased derivative interest, paint a cautiously constructive picture. Traders are watching whether SOL can hold support and clear the $120-$121 area.
Also Read: Bitcoin ETFs Add $1.7B in Two Days as BTC Breaks Higher
This article contains market analysis and price predictions. These are not guarantees. Crypto markets are volatile. Always DYOR. Not financial advice.