
- XLM/USD pair is looking for support level at the RSI 50 before we can see a rebound.
- Stellar is currently under the bearish control after meeting rejection at the $0.899 resistance.
On September 18, Stellar (XLM) recorded a weekly high at $0.0899 after gaining about 30% in just three days of the price surge. Now, a two days retracement has brought the market down by almost -15%, causing the price of XLM to trade currently at $0.0712 along with the technical indicators correcting downward.
Following the recent news surrounding Stellar, its price has currently seen a -4.97% loss over the past few hours. Nevertheless, XLM remains the 11th largest cryptocurrency by market cap.
Stellar (XLM)’s Current Statistics
Trading Price: $0.071
Market Capitalization: $1,434,829,151
Trading Volume: $310,335,502
Key Resistance Levels: $0.077, $0.080, $0.088
Key Support Levels: $0.066, $0.060, $0.058
Stellar Price Analysis September 21, 2019
On the daily time frame, Stellar’s price is dropping back to near support after witnessing a sudden price increase during the week.
While approaching the descending trend line which was broken on September 18, XLM is likely to meet support at $0.066 and potentially $0.060. A drive beneath the yellow line could cause the market to roll back at the monthly low at $0.58.
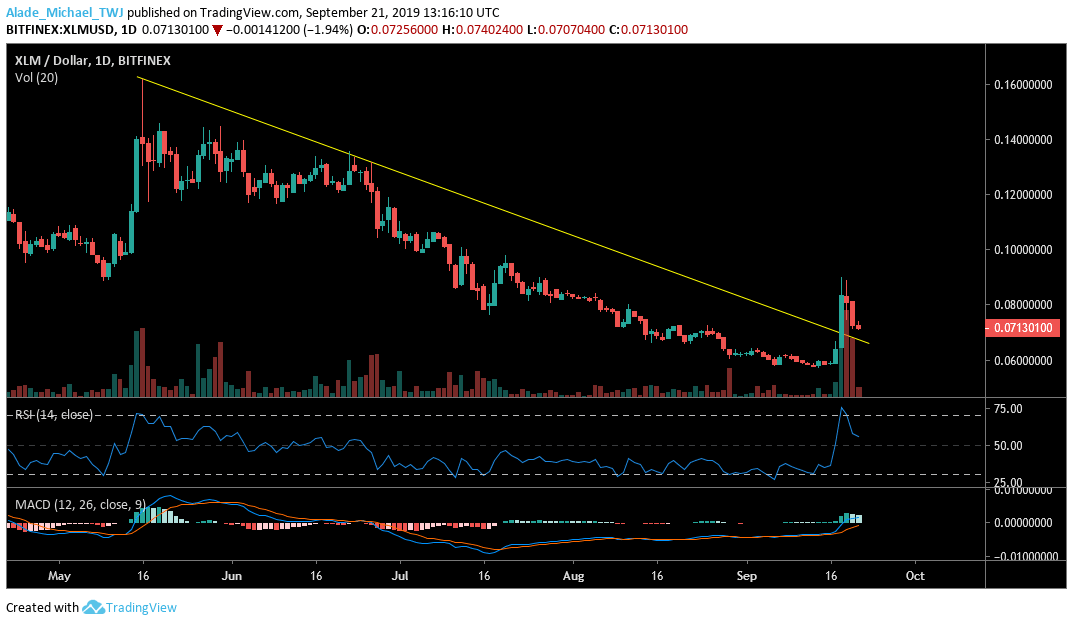
From a technical standpoint, the XLM/USD pair is retracing back for the next impulsive movement, which we may bring buying pressure towards the $0.077, $0.080 and $0.088 resistance if the buyers step back in the market. Currently, the sellers are in control of the market. We can expect the get back in the market once the market finds reliable support.
Conclusively
We should expect the Stellar to bounce back as soon as the market meet support between the $0.066 – $0.060 price zones, where the yellow descending channel lies. If XLM fails to bounce at the mentioned zones, we may see a rollback to the $0.058 – which is currently acting as significant support for the market.
Technical Indicator Reading
RSI has nosedived near the mid-band following the past two days of a price drop. If the RSI 50 can produce support, we can expect a bullish continuation. A break will lead to the mid-year correction.
MACD for Stellar Lumens (XLM) has slightly climbed to the positive zone, reflecting a bullish action in the market. A precise cross will produce more upward movement in the market.
Disclaimer: The presented information is subjected to market condition and may include the very own opinion of the author. Please do your ‘very own’ market research before making any investment in cryptocurrencies. Neither the writer nor the publication (TronWeekly.com) holds any responsibility for your financial loss.
Never miss our daily cryptocurrency news, price analysis, tips, and stories. Join us on Telegram | Twitter or subscribe to our weekly Newsletter.