SUI price shows a tendency toward recovery on a larger scale after a massive fall of 83%, while the Parabolic SAR on a weekly timeframe signals a reversal for the coin.
Table of Contents
SUI Price Signals Bullish Trend Reversal
This latest move follows the observation by crypto analyst Ali Martinez, who observed a big shift in the weekly SUI chart, specifically on September 23. According to Martinez, the dots from Parabolic SAR have crossed below the price level after the cryptocurrency experienced an 83% bear-market crash.
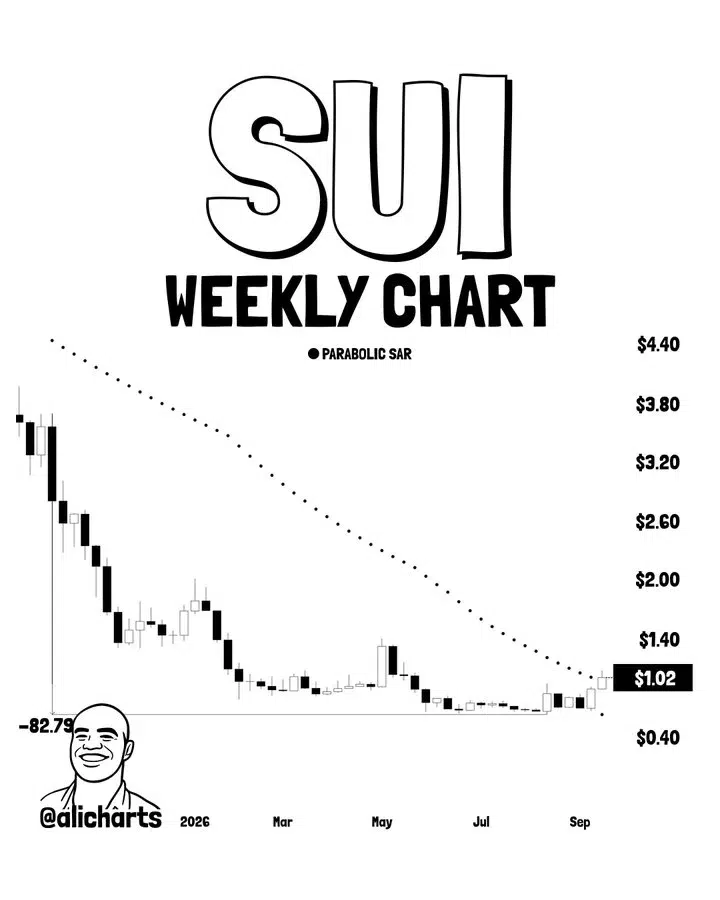
Nevertheless, it is important to note that this signal is more of a trend confirmation than a continuation of price growth. Weekly signals from Parabolic SAR are supposed to follow the current price trends, which implies that the reversal confirms price recovery after some part of it has already been achieved.
Also Read | XRP Ledger Upgrade Gains 29 Validator Votes as Oct. 5 Activation Nears
SUI Price Gets a Major Weekly Trend Signal
Parabolic SAR (Stop and Reverse) is an indicator that puts dots either above or below the price of the underlying asset in order to determine the direction of the dominant trend. When dots are above the price, the trend is bearish; when below the price, it is bullish.
In the case of SUI, the move is crucial since the token has been in a downward trend for some time, during which the SAR has been above the weekly candlesticks. According to Martinez, this is a macro shift from downtrend to uptrend.
The signal also comes along with other improvements in the technical setup. Martinez has earlier mentioned the TD Sequential 13 buy signal and the SuperTrend buy signal as components of the emerging reversal pattern. Parabolic SAR flip provides one more weekly signal to the aforementioned pattern.
It doesn’t imply that SUI should necessarily start rising. Rather, it is necessary to consider whether the token will be able to hold the pattern after the appearance of the signal and establish higher lows above key support levels.
SUI Price Eyes Further Gains After Consolidation
Another analyst, Michaël van de Poppe, has pointed out the improvements in the structure of SUI but warned that a correction might take place prior to another gain.
According to Van de Poppe, SUI is in a consolidation period and is likely to undergo a brief retracement. However, $1.16 and $1.40 emerged as key areas of interest for further gains.
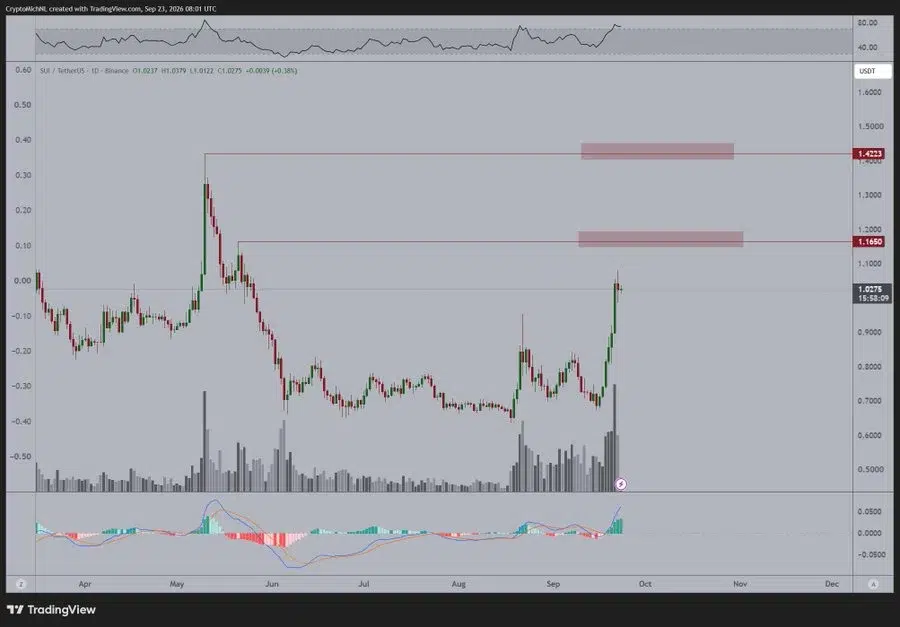
The levels will be significant in that they provide a roadmap for the market. A push towards $1.16 would be a test of the next significant level of resistance, whereas a push towards $1.40 would be an extension of the rally from the lows seen recently.
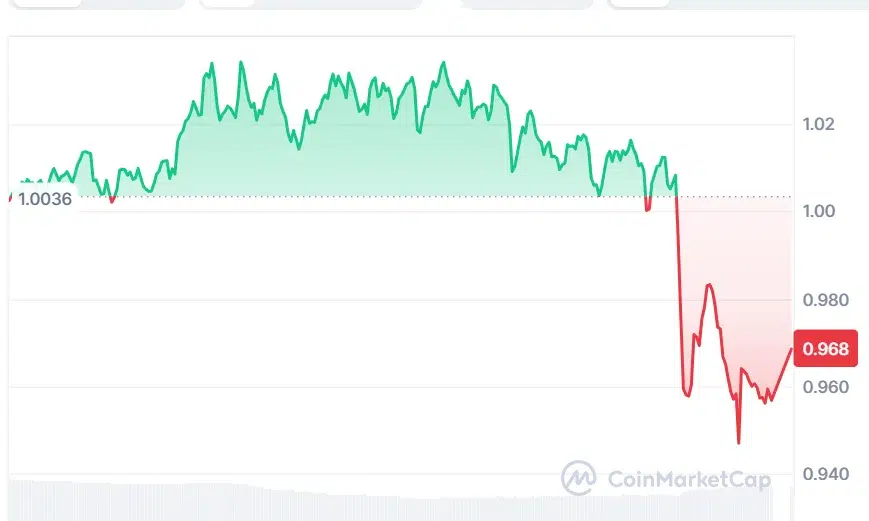
At the time of writing, SUI is trading at $0.9683, down 3.61% over the last 24 hours, while its daily trading volume stands at $1.59 billion and its market capitalization is around $3.90 billion.
SUI Price Momentum Remains Strong on the Daily Chart
Additionally, SUI’s short-term indicators are signaling rising pressure as well, even with the recent drop, which highlights the volatility in the market.
The coin is trading above the middle Bollinger Band level at $0.80472. The upper Bollinger Band stands at $1.00708, while the lower Bollinger Band stands at $0.60237. Given the fact that SUI is still trading close to the upper Bollinger Band level, this indicates that buyers have pushed the price above its average.
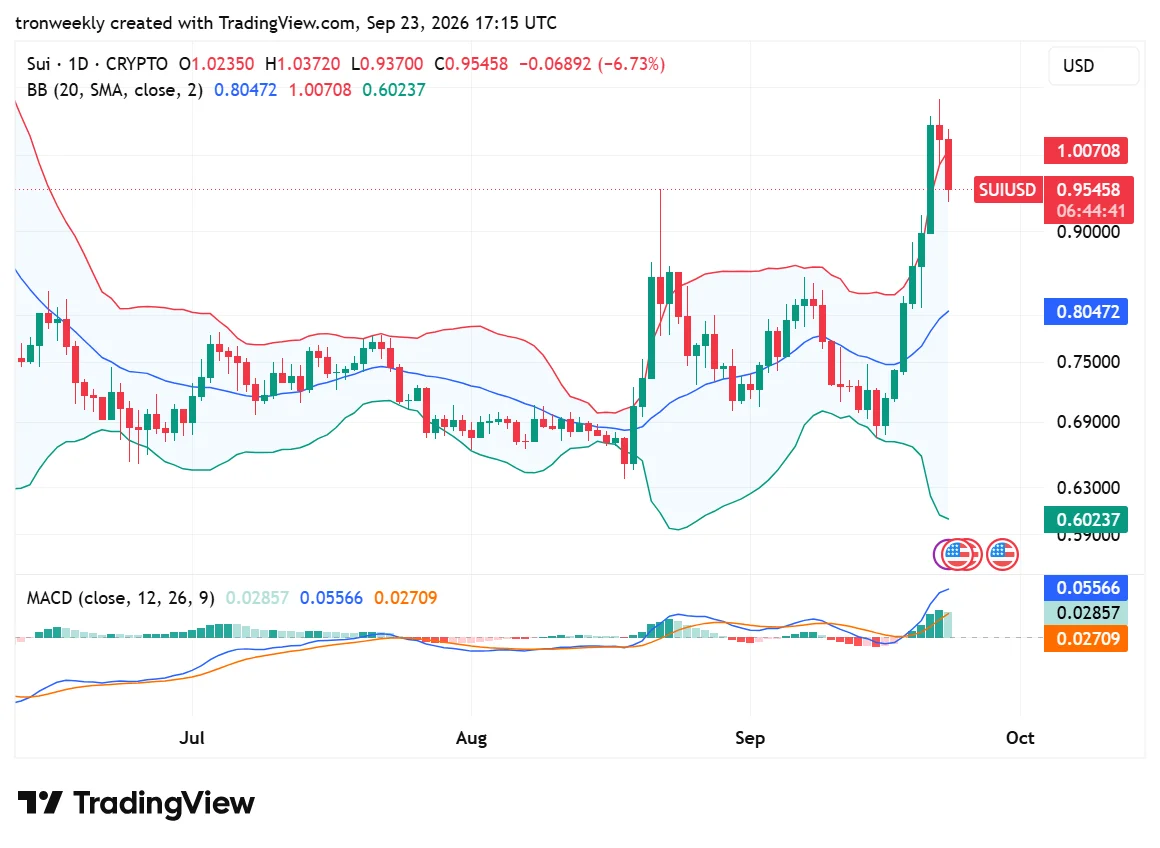
Also, the MACD gives another bullish sign since the MACD line sits at 0.05566 while the signal line sits at 0.02709, resulting in a positive histogram value of 0.02857. Growing green histograms show that bullish momentum is becoming stronger.
However, since SUI has found itself close to the upper Bollinger band currently, it shows that there may be consolidation or pullback phases for the token. Shrinking MACD histograms are early signs that the current momentum is fading out.
Sui Network Developments Add Fundamental Context
The technical recovery is taking place amid other developments within the Sui ecosystem.
The Sui blockchain recently emphasized the ease of stablecoin transactions. It has developed gasless stablecoin payments at the protocol level, which enable applications to abstract the requirement for users to maintain SUI for transaction fees in the case of supported payments. Confidential finance has been mentioned by the Sui Foundation among the areas of development.
All these things are important since a successful recovery for SUI will depend not only on charts but also on other elements like network utilization, dapps, stablecoin use, and development community interest in the token.
What Happens Next for SUI Price?
Where SUI price is headed next will ultimately depend on whether the coin will manage to establish a continuous higher high and higher low pattern from its current recovery.
For the bullish technical outlook to become stronger, SUI will have to preserve its current recovery pattern, remain above the flip of the weekly Parabolic SAR, and break out of the marked resistance levels. The $1 level is especially critical since it lies just under the upper Bollinger Band in the current setup.
However, a short-term correction would not necessarily negate the underlying recovery story either. As Van de Poppe suggests, there is already a possibility for some correction before the token tests new highs.
Aside from price, another factor that will determine if the network’s fundamentals improve enough to underpin a longer-term recovery is the ongoing growth of stablecoin transactions and DeFi transactions on the Sui platform.
Also Read | Solana Price Holds Above Key EMAs as Bulls Target $121
This article contains market analysis and price predictions. These are not guarantees. Crypto markets are volatile. Always DYOR. Not financial advice.