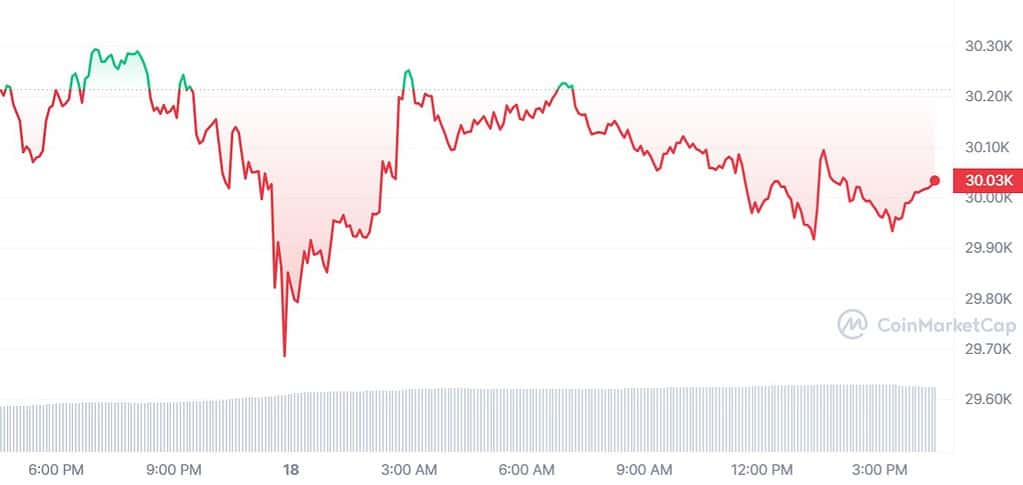
On 18 July 2023, the price of Bitcoin (BTC) fell below the $30,000 mark, which may have come as a surprise to retail investors considering recent developments. However, analyzing the data suggests that this downward movement does not indicate an imminent shift in the overall trend.
Despite the drop, there are some positive aspects to consider. Bitcoin’s price is still making efforts to establish the $30,000 level as support, after around 10 attempts since April of this year. Furthermore, the price consistently finds buyers within the $28,000 to $25,000 range, which seems to be viewed as an accumulation zone by these buyers.
Glassnode’s Bitcoin Accumulation Trend Score, based on on-chain data, supports this sentiment. Depending on how investors interpret the data, it could be seen as a positive sign. The behavior of investors at the $30,000 BTC price mirrors the accumulation behavior observed in the $28,000 to $24,000 range and near the supposed bottom of $16,800.
According to Glassnode, an Accumulation Trend Score closer to 1 indicates that larger entities or a significant part of the network are accumulating, while a value closer to 0 suggests they are distributing or not accumulating.
Essentially, buyers heavily accumulated during the periods from November to December and from March to April when BTC reclaimed the $30,000 level. The metric indicates that they are likely doing the same in July, as BTC strives to overcome the $30,000 resistance or receives a boost from the news surrounding ETFs and XRP SEC.
Bitcoin’s Crucial Pivot: $30K Level as Resistance
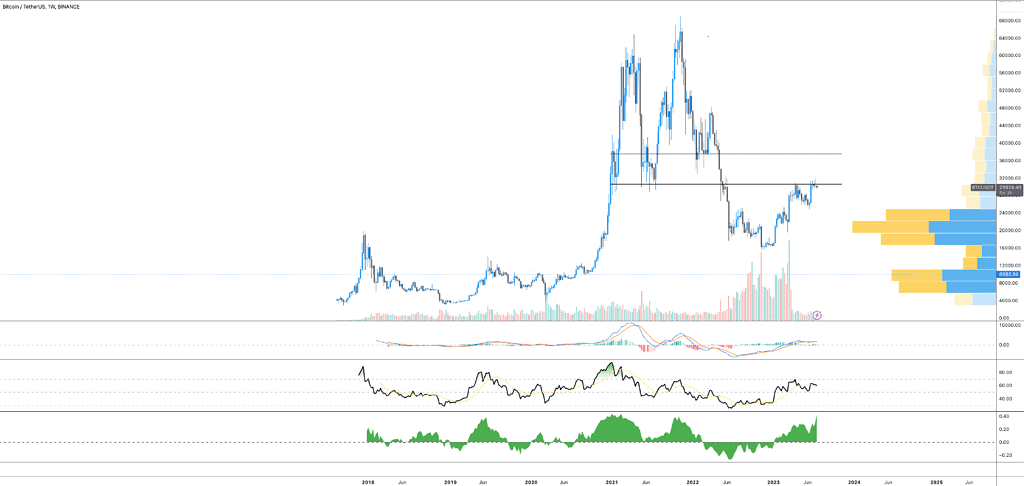
Analyzing the current price action and derivatives market data, it appears that Bitcoin is currently in a crab market. In this type of market, the price remains range-bound and consolidates over an extended period. Analysts have highlighted that a strong push above the $32,000 level could result in filling a CME gap from the Luna Terra-crash era.
Looking at Bitcoin’s weekly market structure, the $30,000 level serves as a crucial pivot point. It previously functioned as support in the previous bull market cycle but now acts as resistance. A breakthrough above this level would establish a higher high on the longer time frame, confirming a trend reversal with the next point of resistance around $37,000.
The activity of traders in the derivatives market also contributes to the current crab market situation. Funding is down, open interest is relatively low, and significant surges in these metrics that would indicate an imminent breakout have yet to emerge. Retail investors who attempt to capitalize on breakouts or support retests through long positions or shorts are struggling in the short term.
A metric to monitor, as suggested by analyst JJ the Janitor, is the aggregate open interest. A sharp breakdown from the current range could present genuine opportunities to “buy the dip.” Currently, the open interest is in an uptrend, although it remains mostly sideways. However, a surge in open interest could be interesting, likely driven by news, regulatory changes, or legislative events.
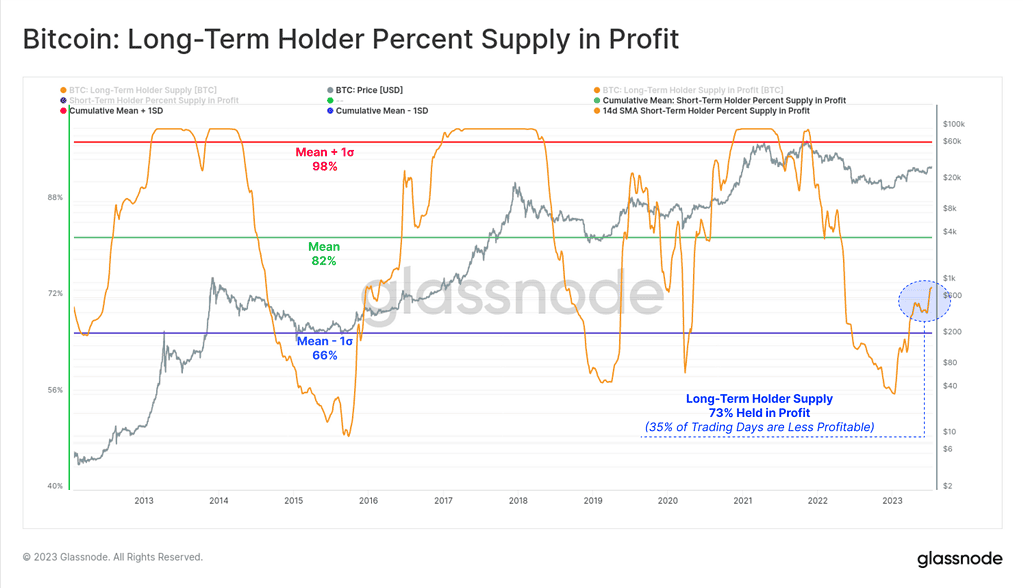
While the short-term price action of Bitcoin may raise concerns among newer investors and day traders, the on-chain perspective remains compelling. Additionally, the Total Balance in Accumulation Addresses metric has been trending upward since March 16, when BTC traded at $25,000.
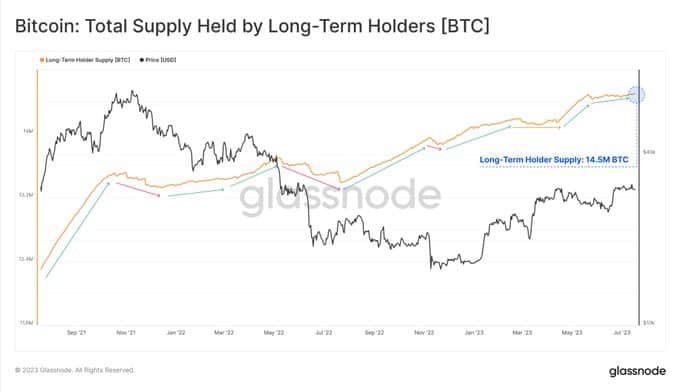
It’s worth noting that this metric also indicates an increase in the total balance held in accumulation addresses since January 2022, when Bitcoin’s price was $47,800 per coin. Despite the crypto market collapse and the sell-off of Bitcoin, multiple on-chain metrics demonstrate that investors continue to allocate more of their holdings to BTC.