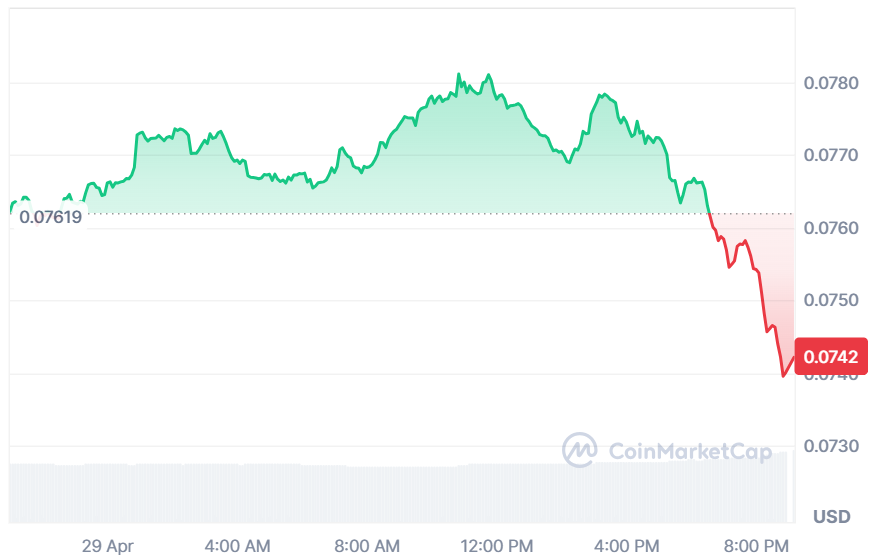
The Sandbox (SAND) is moving in a short-term downtrend as the market is within a cooling-off period due to rising tension between Iran and Israel. According to CoinMarketCap, the token price has declined by 2.79% over the last 24 hours and 5.71% over the last week.
At the time of writing, the token is trading at $0.07414 with a trading volume of $46.98 million, which has surged by 20.85% over the last 24 hours. However, its market capitalization stands at $218.01 million, which is down by 2.81%.
Source: CoinMarketCap
SAND Shows Strength at Key Support Zone
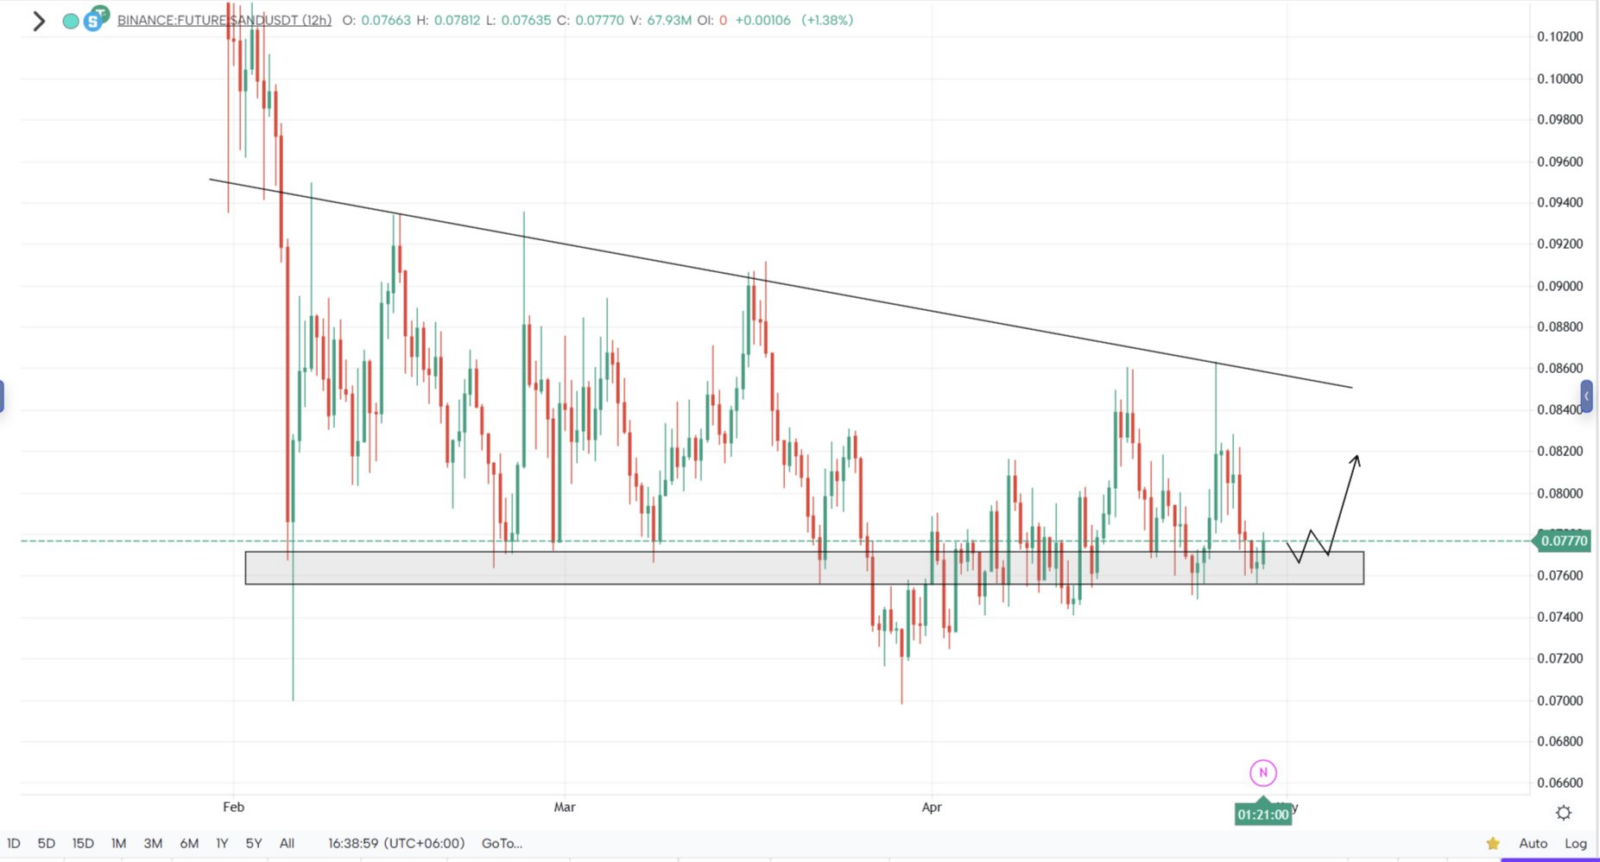
Furthermore, the crypto analyst Alpha Crypto Signal revealed that the token is showing renewed strength as it continues to hold a key support zone, with higher timeframe price action forming a series of green candles.
This structure suggests steady buyer accumulation rather than distribution, while momentum gradually builds, indicating the market may be preparing for a potential directional shift upward.
Source: Alpha Crypto Signal’s X Post
If the support level maintains its ground, expectations would be that the price action would test the trend line that moves downward.
The consolidation in the market will enable the formation of a bull pattern, and the target would be towards $0.085. However, further confirmation is required, and traders are keeping a keen eye on it.
SAND Faces Pressure Below Key Moving Averages
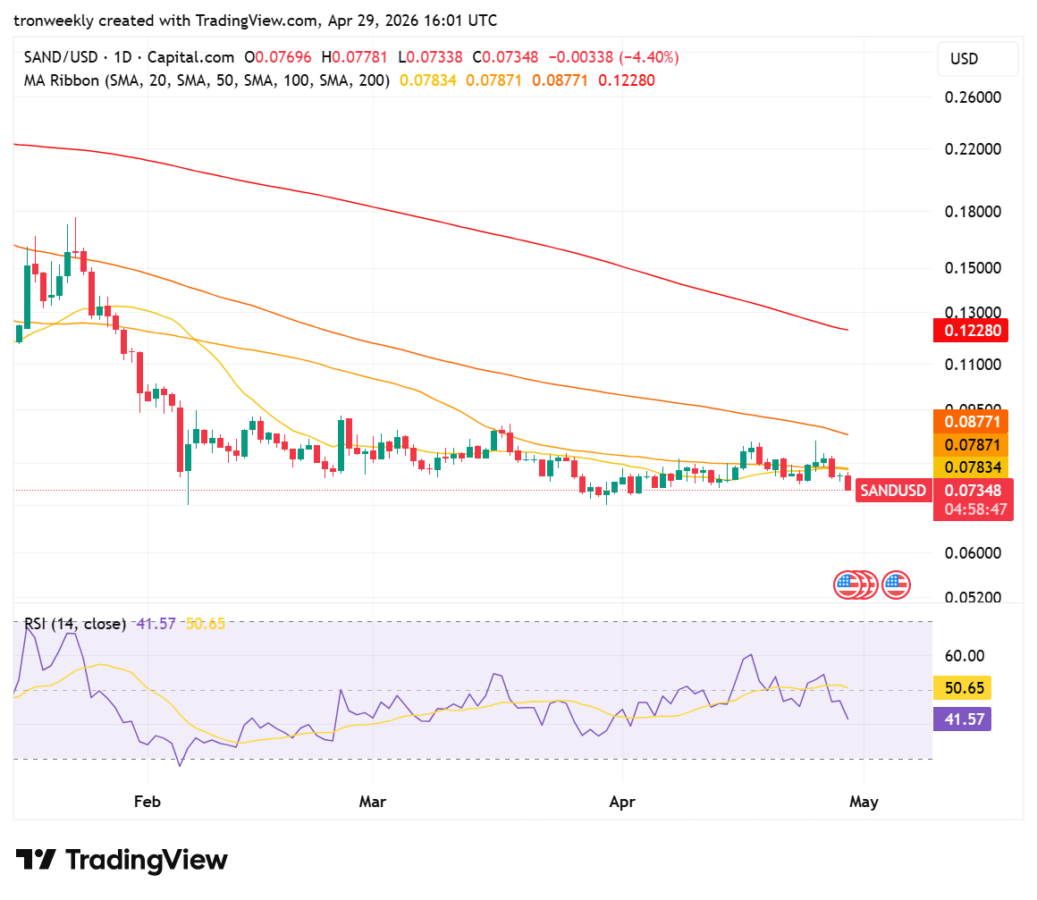
According to TradingView, the token is consistently showing a bearish trend as the token is currently trading below its 200-day simple moving average at $0.12280.
Following its rapid descent early this year, the price is currently consolidating after hitting its lowest point in April. The current level of price is $0.07348, representing a 4.40% fall from yesterday’s price.
Source: TradingView
The technical indicators confirm a negative sentiment since the MA ribbon is spread out wide, providing stiff resistance for any attempt at bouncing back.
The RSI is standing at 41.57 levels, suggesting that although it’s not oversold, there’s bearish momentum in the market. A break below the support level may trigger further falls towards the $0.060 levels.
This article contains market analysis and price predictions. These are not guarantees. Crypto markets are volatile. Always DYOR. Not financial advice.
Also Read: The Sandbox (SAND) Falling Wedge Signals Potential Breakout to $2.65