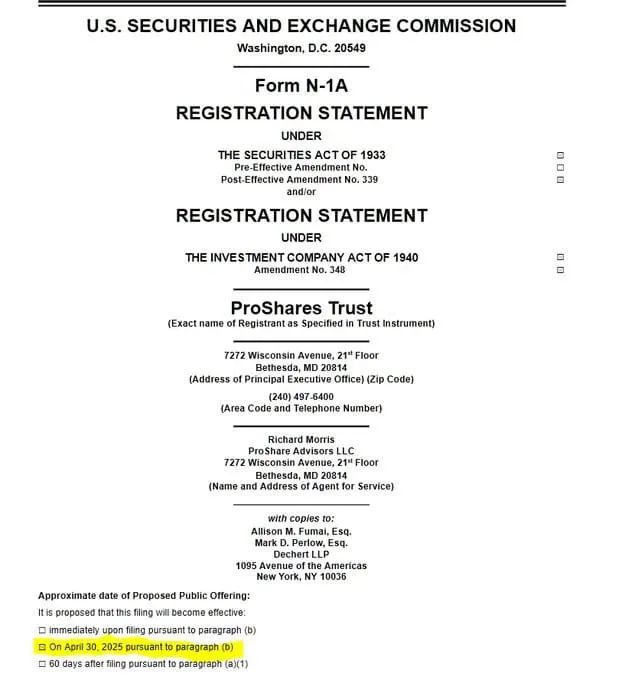
- ProShares files for a spot XRP ETF targeting April 30, 2025, joining 17 other applications, including TradFi giant Franklin Templeton.
- NYSE Arca greenlights Teucrium’s 2x Long Daily XRP ETF, a high-risk, high-reward instrument for active traders and institutions.
- Technical analysis shows a bullish ascending triangle and a Stoch RSI setup mirroring 2017’s 22x XRP price surge.
ProShares has filed a spot XRP ETF with a target launch date of April 30, 2025. The listing comes after Franklin Templeton, a TradFi giant with over $1.5 trillion under management, also filed for an ETF with the SEC. This marks the 18th filing for the crypto ETF, with big names like Bitwise, Grayscale, Canary Capital, and WisdomTree already in the mix.
The token is among the few altcoins to receive significant institutional interest for creating investment vehicles. Wall Street’s NYSE Arca recently greenlighted Teucrium’s 2x Long Daily XRP ETF, a series of LISTED FUNDS TRUST, under the Exchange Act of 1934. the 2x suggests that this particular ETF uses swaps to double the daily return of the token. This means if the asset goes up 1% in a day, this ETF is designed to return +2%. High risk, high reward, built for both active traders and institutions.
XRP’s Technical Indicators Flash 2017 Scenario
On the price outlook, experts paint a highly bullish outlook for the token based on historical Stoch RSI behavior. The 2-month candlestick chart depicts an ascending Triangle Pattern, marked by a rising lower trendline and a horizontal upper resistance line near the $1.90 – $3.37 range. Typically, this is seen as a bullish continuation pattern, hinting at a potential breakout on the upside.
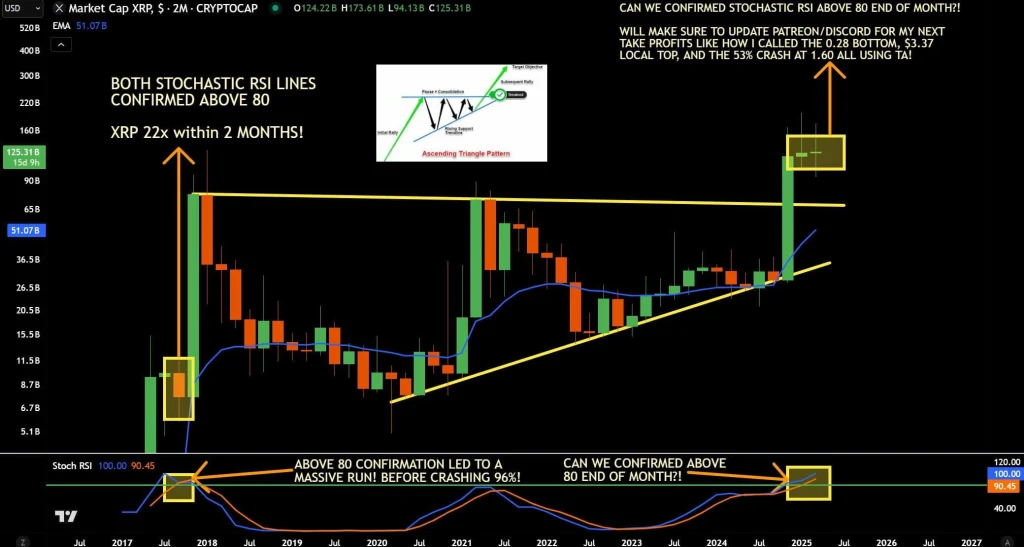
Secondly, the current Stoch RSI setup appears to mirror 2017, where both the lines confirmed a close above the 80 level. This was followed by a whopping 22x price increase in the two months. Market analysts are looking for a similar confirmation above 80 at the end of the current 2-month candle.
For those new, the Stoch RSI moves between 0 and 100 and has two lines. Here it is marked %K (blue) and %D (orange). The levels 20 and 80 usually mean oversold and overbought thresholds, respectively.