
The XRP price drew attention on Friday, August 28, 2026, as the analyst maintained his short-term technical outlook and U.S. spot exchange-traded funds recorded a third consecutive session of positive net inflows during the period.
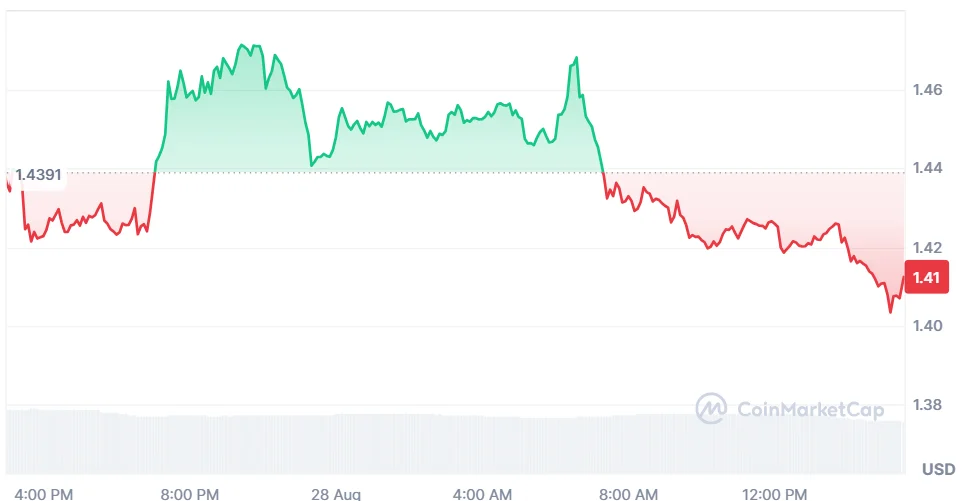
As of writing, XRP is trading at $1.41, showing a decline of 0.93% in a day. The 24-hour trading volume is currently standing at $3.43 billion, with a market capitalization of $88.66 billion. Over the last week, the XRP coin price has increased by 2.65%, according to CoinMarketCap.
Also Read: Cardano Price Eyes $0.23 Breakout as Leios Boosts Bullish Outlook
How XRP Price Could Reach $1.80 After a Structural Retest
Popular analyst Egrag Crypto noted that his unchanged short-term tracker continues to identify $1.15–$1.20 as a major structural retest zone.
The range combines horizontal support, the structure’s lower boundary, and the tracker’s projected pullback area. He described it as a logical level for buyers to defend.
His projected route starts around $1.40 and includes a gradual move toward $1.15–$1.20. It then shows a recovery attempt before a test of the $1.63–$1.65 range for the XRP price.
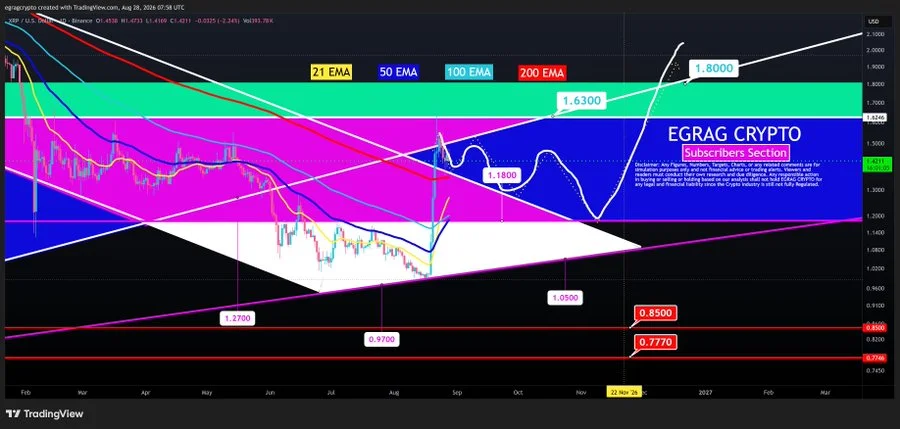
The analyst also identified a breakout condition. A full weekly body close above $1.65 would change the market structure and prompt a reassessment at higher levels. In that scenario, $1.80 would become the next major upside checkpoint.
What XRP’s EMA and MACD Readings Signal
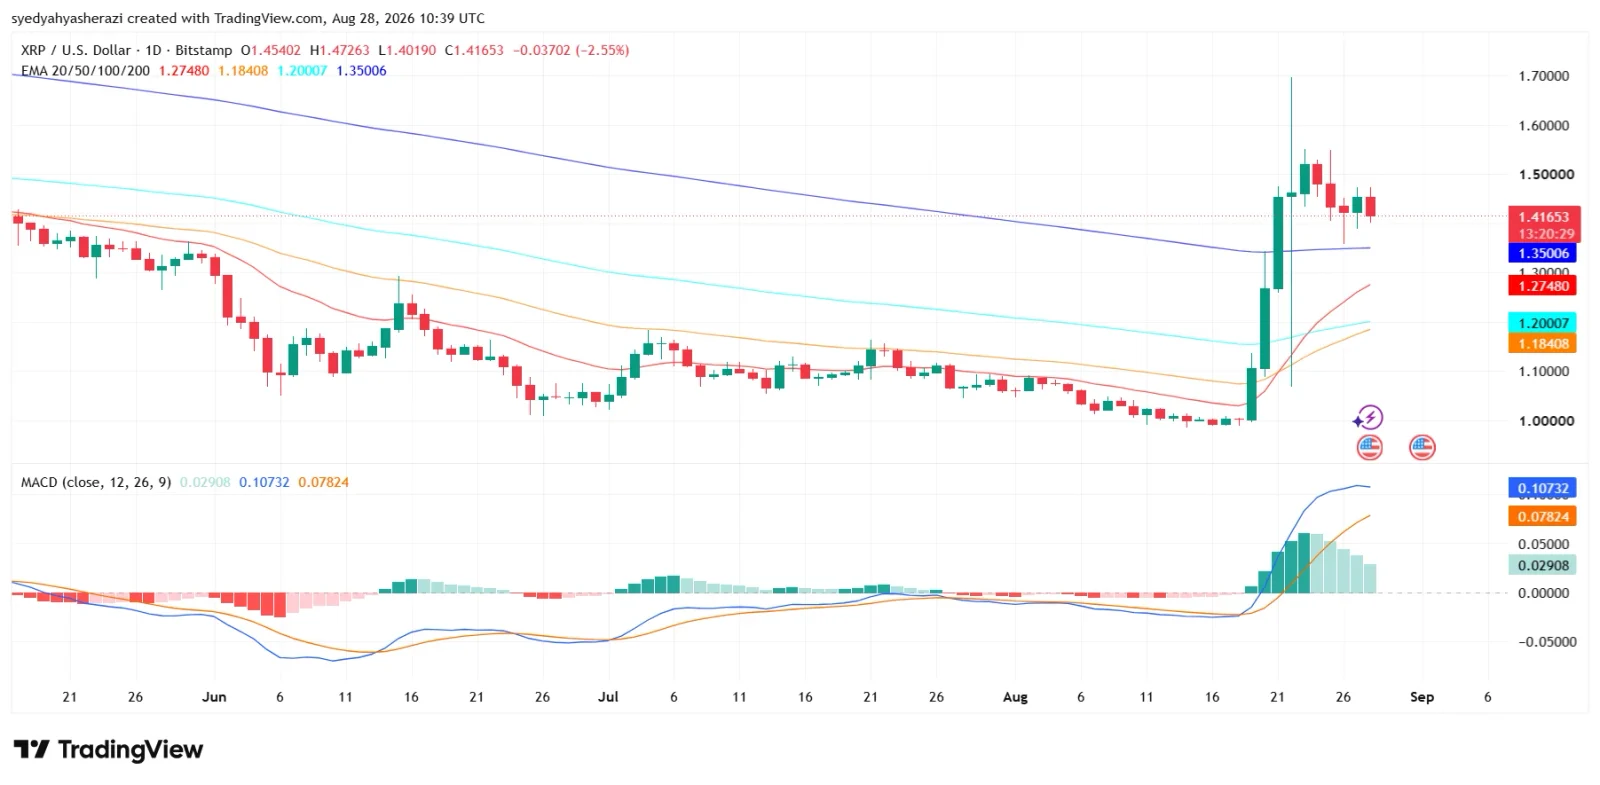
According to TradingView, the 20-day Exponential Moving Average (EMA) stands at $1.27480, while the 50-day EMA is at $1.18408. With the XRP price near $1.41, both averages remain below the current market price.
The 100-day EMA stands at $1.20007, while the 200-day EMA is at $1.35006. The XRP price remains above all four averages shown on the chart. The 200-day EMA is the closest average to the current market price.
The Moving Average Convergence Divergence (MACD) line stands at 0.10732, above the signal line at 0.07824. The histogram remains positive at 0.02908. However, the shrinking histogram bars indicate that bullish momentum may be easing.
XRP ETFs Recorded Three Straight Days of Inflows
According to SoSoValue data, the daily net inflow for U.S. spot XRP ETFs on August 27 is $18.47 million. The cumulative net inflows were $1.64 billion. The total net assets stood at $1.49 billion.
The ETFs registered a daily traded value of $85.90 million, as XRP trading closed near $1.46. They also garnered $28.14 million on August 26 and $23.87 million on August 25. The total net assets rose from $1.40 billion on August 26 to $1.49 billion on August 27.
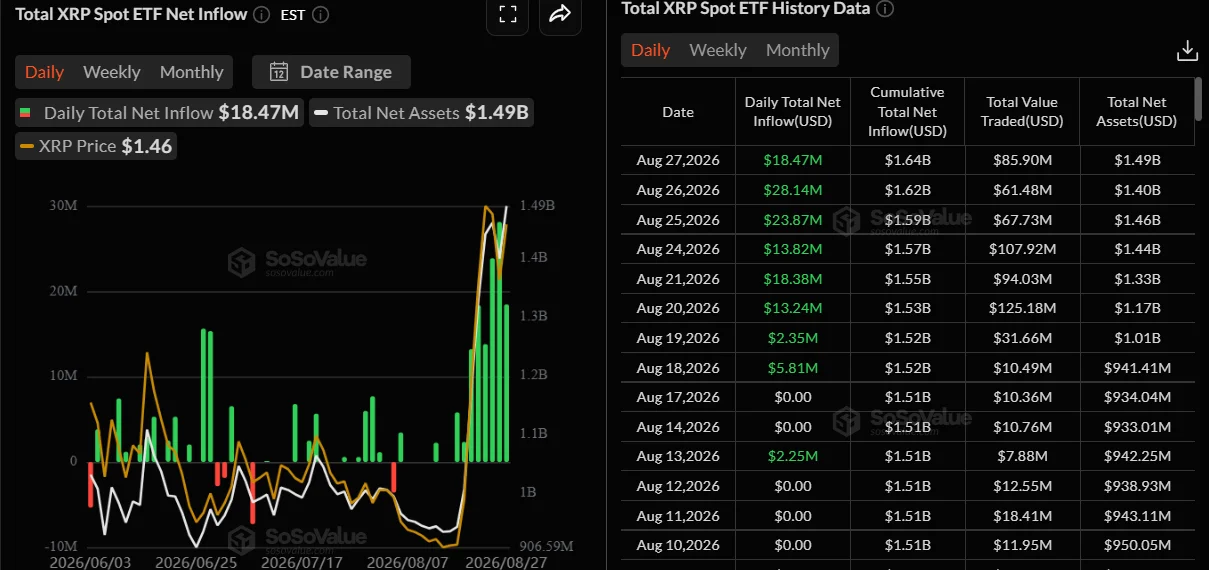
The figures showed three consecutive days of positive net inflows. On the other hand, the Egrag analysis pointed out the clearly defined support and breakout levels.
According to the analyst, the XRP price needs a full weekly body close above $1.65 to confirm his stated breakout condition.
Also Read: TRUMP Price Surges as Breakout Puts $2.90 Resistance Level in Focus