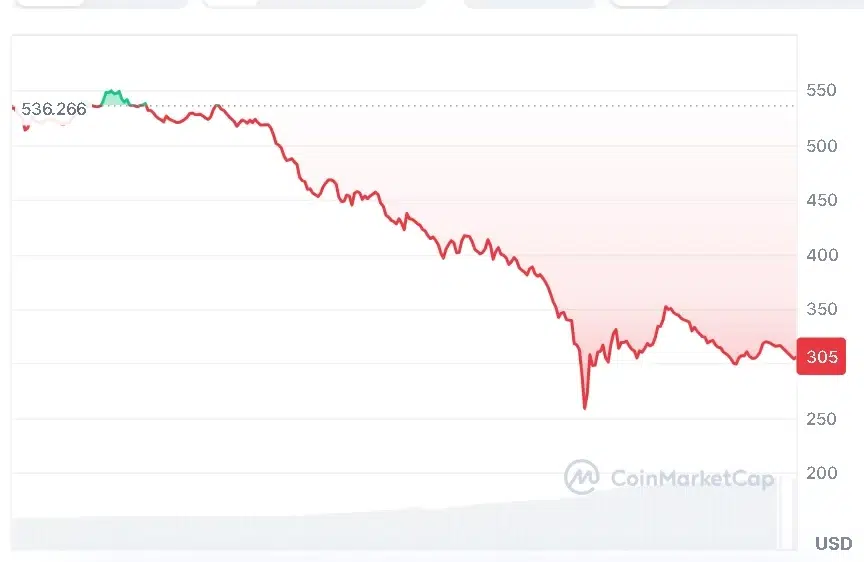
Zcash (ZEC) price has seen tremendous pressure due to a heavy sell-off within a day, leading to a loss of confidence among investors in the market. At the time of writing, ZEC is trading at $305.39, with its daily trading volume standing at $9.12 billion and market capitalization being $5.27 billion. Over the last 24 hours, there has been a decrease of 39.48%in the Zcash price.
Also Read | Ripple RLUSD Drives Multichain Growth via Wormhole in 2026
Zcash Price Breakdown After Key Support Loss
The last action from the Zcash price comes after a fast breakdown that took the cryptocurrency down past several major technical points. The fall came quickly after the close at $319.73, indicating a daily decline above 30%. This is worrying as the market becomes more volatile in the lower areas.
On June 5, 2026, a crypto analyst, Crypto Patel, observed that this fall was expected since he had warned about the high risks involved if the Zcash price ranged from $680 to $750. Based on his forecast, the Zcash price is now down below $350, and at some moments it dropped even lower to $250.

In addition, Patel also identified a recurring pattern involving corrections, with the sharp rises seen in the Zcash price being immediately reversed. According to him, the current correction is reminiscent of a prior one that involved a steep fall in the price of ZEC.
Technical Signals Show Weakening Zcash Price Structure
Technical analysis reveals that the Zcash price is under pressure. The coin dropped below the middle point of the Bollinger Bands at $568.41 and has even gone below the lower bands of the Bollinger Bands at $411.01. It indicates that the sellers have been in control, and the bulls failed to make gains.
The increased distance between the upper and the lower bands indicates growing volatility in the Zcash price, and it is a signal that volatile price movements have become commonplace. Such formations typically form when there is a strong reversal of a trend.

Momentum indicators also point to the same conclusion. The MACD line has crossed below the signal line, whereas the histogram is still printing increasingly negative levels. This signals that the momentum of the Zcash price is increasing on the downside, and any reversal could come only with increased buy interest.
Overall, the price of Zcash still experiences strong downward pressure, as technical factors and current events continue to indicate further volatility in the near term.
This article contains market analysis and price predictions. These are not guarantees. Crypto markets are volatile. Always DYOR. Not financial advice.
Also Read | SpaceX IPO Sparks Explosive Retail Investment Boom 2026