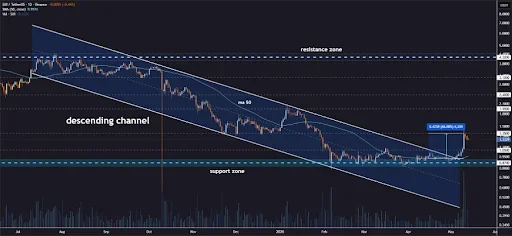
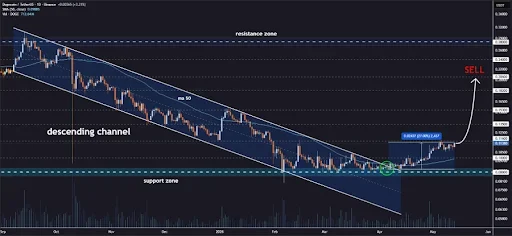
Dogecoin price has experienced a breakout of its long-term descending channel formation on the daily chart, which could indicate a possible reversal of the current price trend. This breakout could be facilitated by growing bullish sentiment among investors.
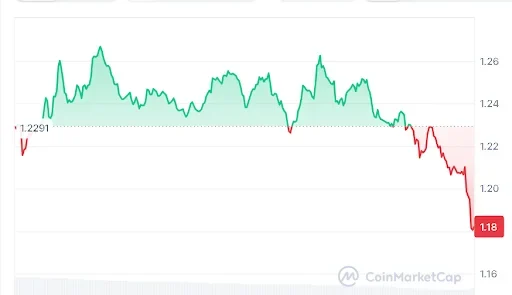
At the time of writing, DOGE is trading at $0.1117. The token has moved up 2.07% over the last 24 hours, while its 24-hour trading volume stands at $2.57 billion, and its market value is $18.73 billion. The latest price action shows growing strength after a period of sideways movement.
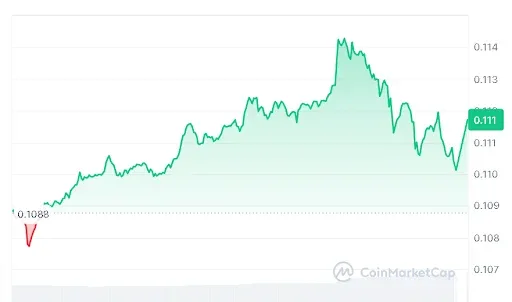
Source: CoinMarketCap
Also Read | Ethereum Security Targets $1.5 Billion Hack Risk
Dogecoin Price Breakout Confirms Shift Toward Buyers
Crypto analyst, Jonathan Carter, highlighted that DOGE had been able to break out of its downtrend channel formation on the daily time frame. The breakout is said to be validated since there is constant buying momentum and a positive market structure.
Source: Jonathan Carter’s X Post
The breakout occurred after several consolidation periods during which the price kept testing the resistance level before breaking out from the downtrend line.
He predicts that Dogecoin price would be trading at $0.135, $0.153, $0.182, and $0.206 as its potential levels of upside targets, according to his prediction. However, he stressed that as long as the prices stay above the breakout area, the bullish pattern will remain intact because buyers are controlling the price action.
Dogecoin Market Sentiment Turns Positive
The market sentiment is showing improvement towards the Dogecoin price. There has been an increase in trading volume by 11.88% to $2.90 billion and open interest by 2.24% to $1.65 billion. The increased participation indicates a healthy market sentiment for the coin, which would have contributed to its upside performance.
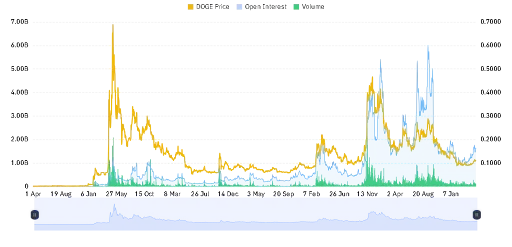
Source: Coinglass
However, the positioning of derivatives is still quite balanced. The funding rate based on open interest is just 0.0058%. This means that although the momentum for the Dogecoin price has been increasing, the risk exposure has still been kept in check, making it easier for the breakout pattern to emerge.
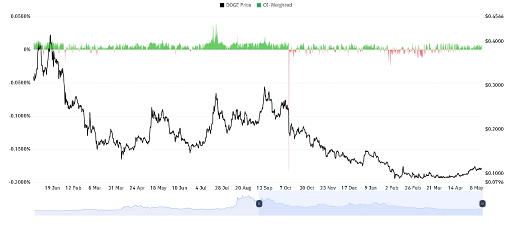
Source: Coinglass
This article contains market analysis and price predictions. These are not guarantees. Crypto markets are volatile. Always DYOR. Not financial advice.
Also Read | JPMorgan Files for JLTXX Tokenized Money Market Fund on Ethereum