• Skip to primary navigation
  • Skip to main content
  • Skip to primary sidebar
  • Skip to footer
  • About TronWeekly
  • Write for us
  • Terms and Conditions
  • Privacy Policy
  • Disclaimer
  • Contact
  • All Posts
  • Advertise

TronWeekly

Crypto World News

  • Home
  • Latest News
  • Opinion
    • Education
    • Best TRON Wallets
    • Beginner’s guide to TRON
    • Tron Tokens
    • Market Analysis
  • Industry
    • Tron Exchange
    • Project Review
  • Press Release
  • Bitcoin (BTC)
  • Ripple (XRP)
  • Advertise
  • About TronWeekly
    • The Team
    • Editorial Policy
    • Write for us
    • Privacy Policy
    • Disclaimer
    • Terms and Conditions
    • Contact
You are here: Home / All Posts

All Posts

Bitcoin Price Drops to $67K as $4.2 Billion ETF Outflows Trigger Market Selloff

By Sajjal Ali | Edited By Messam Raza,June 5, 2026, 1:24 AM

The Bitcoin price has entered another difficult phase after dropping to nearly $67,000, reversing much of the recovery seen earlier this year.

A combination of stronger U.S. economic data, rising bond yields, and continued institutional selling has increased pressure on the market. According to Glassnode, U.S. job openings reached 7.62 million in April, significantly above expectations.

The 10-year Treasury yield rose above 4.45% as markets reassessed Federal Reserve policy, with expectations shifting toward higher rates by 2026, increasing pressure on risk assets like Bitcoin.

At the same time, U.S. spot Bitcoin ETFs recorded $4.21 billion in outflows over three weeks, the largest institutional withdrawal streak this year, signaling reduced investor exposure.

Focus is now on the upcoming U.S. nonfarm payrolls report, which could set the next direction for financial markets.

Bitcoin Price Returns to Bear Market Territory

On-chain data suggests the Bitcoin price has slipped back into a bear-market-like range after failing to hold above the True Market Mean at $77,800. With BTC now near $67,000, it is moving closer to the Realized Price of $53,900.
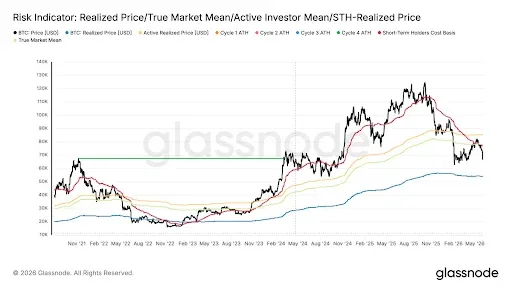
Bitcoin Price Returns to Bear Market Territory

Source: Glassnode

Short-term holders’ cost basis has dropped to $76,400, signaling weaker confidence and increased selling pressure.  Meanwhile, the Realized Profit and Loss Ratio fell sharply from 3.16 in May to 0.29, showing losses now outweigh profits after the failed move above $80,000.

Also Read: Bitcoin Supply Dynamics Defy Logic Post 1.24M BTC Absorption

Losses Accelerate as New Buyers Face Pressure

The recent decline has pushed many Bitcoin buyers into unrealized losses, particularly those who entered between $78,000 and $82,000. As prices near breakeven levels, the risk of further selling may increase.

Glassnode data shows daily realized losses have reached $1.35 billion, with long-term holders accounting for about $770 million and newer investors making up the rest, signaling broad-based selling pressure across the market.
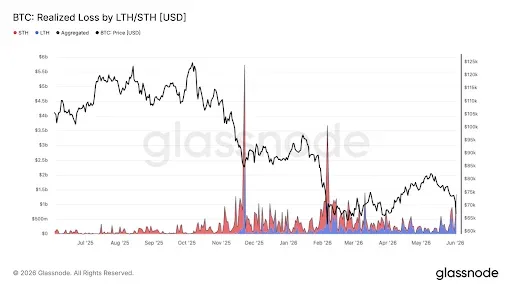
Losses Accelerate as New Buyers Face Pressure

Source: Glassnode

ETF Resistance and Options Market Signal Caution

The Bitcoin price bounce at $83,000 failed when lots of investors sold instead of buying. This support level turned into resistance. Now, spot demand is weak, and the 7-day volume drop shows sellers are leading the pack.
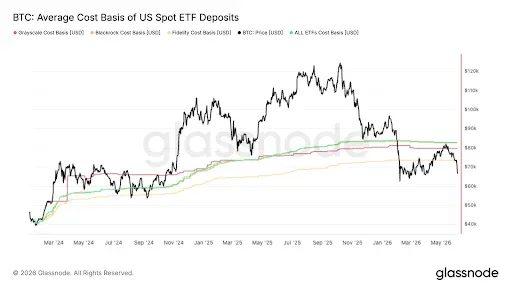
ETF Resistance and Options Market Signal Caution

Source: Glassnode

Over $400 million in leveraged long bets vanished when Bitcoin fell under $70,000. Plus, options markets aren’t bullish: put options outweigh call options. Key gamma levels between $65,000 and $70,000 indicate volatility’s not done yet.
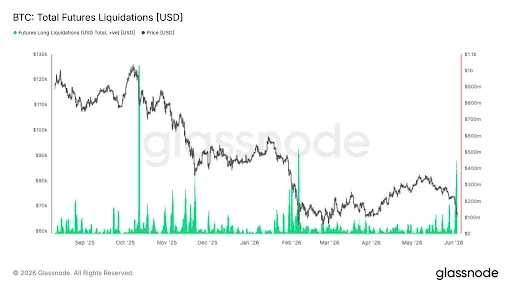
ETF Resistance and Options Market Signal Caution

Source: Glassnode

This article contains market analysis and price predictions. These are not guarantees. Crypto markets are volatile. Always DYOR. Not financial advice.

Also Read: Tether and Fasset Launch First Gold-Backed Visa Card Globally

Filed Under: Cryptocurrency News, Bitcoin (BTC)

Bybit Adds Support for Western Union’s USDPT Stablecoin

By Arslan Tabish | Edited By Messam Raza,June 5, 2026, 1:00 AM

USDPT stablecoin entered a major crypto trading venue after Bybit added support for Western Union’s dollar-pegged token. The listing allows users to hold, trade, and transfer the asset. Bybit said it is the first major crypto exchange to support USDPT.

The companies confirmed the integration on Thursday. The listing marks Western Union’s digital dollar as more than just a payments use case and introduces yet another dollar-backed stablecoin to Bybit’s portfolio.

Also Read: US Treasury Schedules $12.5B Debt Buyback Amid Market Shifts

Western Union USDPT Stablecoin Gains Exchange Access

USDPT is the stablecoin launched by Western Union in May. Western Union Digital is the provider of the token. The asset is supported by the reserves held at Anchorage Digital Bank.

Source: Western Union

USDPT is a stablecoin that was initially introduced on the Solana blockchain. Western Union has called the token part of its digital asset plan. The company said the product was designed to align with the US GENIUS Act framework.

The GENIUS Act set federal regulations for stablecoins. Western Union stated that USDPT is a stablecoin, aligned with this regulatory direction. The listing will provide the token with wallet exchange and trading platform access.

In addition, Bybit’s support provides a new path for transfers. According to the exchange, users are now able to access the USDPT stablecoin on the exchange. The company’s statement did not specify any other blockchain support.

The listing follows a surge in payments activity. Stablecoins are still a significant portion of the digital asset sector. According to DeFiLlama data, the total value of stablecoins pegged to the dollar has reached nearly $320 billion.

Payment Giants Expand Stablecoin Settlement Plans

Western Union is among the new payments providers entering the market. Recently, MoneyGram has released its own protocol, called MGUSD. That product is also linked to plans for blockchain payments and for sending money across borders.

Stablecoins are added to Mastercard’s list of supported services. The company added support for USDC, PayPal USD, and Ripple USD. It also intends to offer settlement alternatives for a number of card transactions with regulated stablecoins.

Visa said it has made progress in the stablecoin settlement. The company reported that its pilot achieved a $7 billion transaction run rate annually in April. The update highlighted increased testing of blockchain settlement rails.

The USDPT stablecoin is part of the broader payments trend. Western Union’s token is tied to access to trading on the Bybit listing. It also positions the asset next to other stable coins that are used for settlements and transfers.

Also Read: MicroStrategy Faces $10.8 Billion Bitcoin Loss Amid Market Pressure and Decline

Filed Under: Cryptocurrency News

Strategy Loss Reaches Record $10.8 Billion as Bitcoin Decline Hits Michael Saylor’s Firm

By Zagham Abbas | Edited By Messam Raza,June 5, 2026, 12:54 AM

Strategy loss has reached a record level as Michael Saylor’s Strategy continues to feel the impact of Bitcoin’s decline. The company’s aggressive Bitcoin buying plan is facing issues now that Bitcoin has dropped below $62,500. They’ve got about $10.8 billion in unrealized losses because of this price drop.

Strategy Loss Grows as Bitcoin Holdings Drop in Value

On June 4, 2026, the Kobeissi Letter reports that Strategy loss hit a new high recently. The company poured about $63.89 billion into Bitcoin over the last six years, trying to build its position.

The value of those holdings dropped to about $53.08 billion, causing an unrealized Strategy loss of roughly $10.8 billion. This leads to one of the largest paper losses from a publicly traded company’s crypto investment ever recorded.

Strategy Loss

Source: The Kobeissi Letter’s X Post

Despite the setback, Strategy still leads with the largest Bitcoin stash at 843,706 BTC—around 4.02% of all Bitcoin out there. Their cash moves with each Bitcoin price change.

Increasing losses, though, have rattled investor confidence. MSTR’s stock dropped about 77% from its peak, mostly because of Bitcoin’s fall.

At the same time, the wider stock market has done better. Since Saylor started buying Bitcoin, the S&P 500 is up about 116%, way more than Strategy’s Bitcoin focus.

Also Read | Shiba Inu Exchange Inflows Hit 30-Day Peak Amid Price Pressure

Debt Obligations Add to Financial Challenges

Besides the unrealized Strategy loss, the company is tackling hefty financial obligations. Their website reveals that Strategy carries about $6.7 billion in notional debt.

The firm needs to pay annual interest and preferred shareholder dividends. By the end of May, Strategy’s cash was down to about $871 million after spending $1.5 billion on debt repurchases.

The cash they have is thought to only cover about six months of those yearly preferred dividend obligations, which come out to roughly $1.7 billion.

Investors are gearing up for Strategy’s shareholder meeting on June 8. There, they’ll vote on whether to boost STRC’s preferred share dividends, switching the payment schedule to bi-monthly from monthly.

This move could hint at how management plans to juggle short-term financial duties with their long-term Bitcoin strategies, making it pretty significant.

Bitcoin Recovery May Ease Strategy Loss Worries

The company’s future depends mostly on Bitcoin. If it continues to fail, folks will worry more about the growing Strategy losses, which are really concerning.

Some market analysts think Bitcoin might have support around $61,000. They see that area like one from earlier in the year, where, after investor adjustments to broader declines, there was a noticeable bounce back.

Shareholders and crypto market folks will keep a close eye on Bitcoin. They want to see if it regains momentum and helps shrink the massive strategy loss at Michael Saylor’s firm.

Also Read | Peter Schiff’s Tether Prediction Sees USDT Overtaking Ethereum and Bitcoin

Filed Under: Cryptocurrency News

XRP Price Near Critical Breakout As Massive 14-Year Pattern Signals Explosive Move

By Sajjal Ali | Edited By Ammar Raza,June 4, 2026, 11:51 PM

XRP price is currently moving inside a long-standing consolidation structure that has been building for several years after the 2018 peak.

JD pointed out that past cycle timing calls around XRP extremes led to significant gains for some traders, and he believes the current structure may again create a large opportunity.

His approach remains chart-focused, arguing that XRP action has historically responded more to technical structure than narrative-driven utility discussions.

As XRP continues to compress toward the apex of its multi-year formation, volatility is steadily shrinking, often a sign that a larger directional move is approaching.

XRP Price analysis

Source: X

Also Read: Tether and Fasset Launch First Gold-Backed Visa Card Globally

Multi-Year Structure Keeps XRP Price Locked in Range

The long-term monthly chart shows XRP trapped inside a symmetrical triangle formed by descending resistance and rising support.

This structure has developed since 2018 and reflects years of equilibrium between buyers and sellers. Every rally in XRP price toward the upper boundary has faced rejection, while dips have consistently found support at higher levels than previous cycles.

This tightening range indicates sustained accumulation behavior and growing pressure for a breakout. The continued contraction in XRP movement suggests the market is preparing for a decisive shift once either support or resistance breaks with strength.

XRP Price Breakout Outlook and Historical Cycle Strength

Crypto Patel highlighted that the XRP has survived more than 14 years in the market since the XRP Ledger launched in 2012.

He noted that XRP began trading at fractions of a cent, near $0.0058, before experiencing major cycle expansions and corrections over time.

XRP price reached an all-time high of nearly $3.84 in 2018 and later faced a deep decline following regulatory pressure, falling more than 90% at its worst stage.

XRP Price Breakout Outlook and Historical Cycle Strength

Source: X

Despite these setbacks, XRP price recovered strongly in later cycles, again approaching multi-year highs near $3.66 in 2025. Today, XRP price trades around $1.20, still reflecting a massive long-term gain from early levels.

Patel suggested that if the next cycle strengthens, the XRP price could potentially move toward the $10 to $20 range, though this remains a personal outlook rather than a guaranteed outcome.

This article contains market analysis and price predictions. These are not guarantees. Crypto markets are volatile. Always DYOR. Not financial advice.

Also Read: Binance Alpaca Stake Confirmed in Revised Trading Terms

Filed Under: Cryptocurrency News, Altcoin News

VIRTUAL Price Sets Sights on $1 as Chainlink CCIP Upgrade Boosts Confidence

By Mishal Ali | Edited By Ammar Raza,June 4, 2026, 11:39 PM

The Virtuals Protocol (VIRTUAL) is outperforming many other altcoins, grabbing investors’ attention as a possible leader in any future market upturn, despite general market weaknesses. Though short-term indicators show bearish momentum will continue for the VIRTUAL price, any boost in Bitcoin’s performance could benefit the project too. Additionally, the network enhanced its cross-chain setup with a security-focused upgrade.

At the time of writing, VIRTUAL is trading at $0.6748 with a 24-hour trading volume of $188.52 million and a market capitalization of $443.4 million. Despite the 9.58% loss over the last 24 hours, the VIRTUAL price structure and network growth could lead to new highs.

VIRTUAL Price Chart

Source: CoinMarketCap

VIRTUAL Price Could Hit $1 If BTC Reclaims $70K

According to the crypto analyst Sky Crypto, the VIRTUAL price is showing strength while Bitcoin (BTC) keeps going down. Many other altcoins struggle to keep momentum, but VIRTUAL does better. 

This makes it stand out and grab traders’ attention. Typically, top-performing altcoins start to excel before the entire market turns around. So, VIRTUAL could be an early signal of improving market conditions ahead.

VIRTUAL Price Could Hit $1 If BTC Reclaims $70K

Source: Sky Crypto’s X Post

Bitcoin watchers are waiting for its next big move. The $70,000 mark is crucial; reaching it could ignite more buying enthusiasm. If Bitcoin can hit and keep above that, $1 could be in play for the VIRTUAL price. 

Interestingly, strong altcoins typically make their case when times are tough, highlighting VIRTUAL as a coin to keep an eye on.

Also Read: VIRTUAL Price Shows Recovery Signals as Breakout Structure Strengthens

VIRTUAL Faces Pressure Below Key Moving Averages

According to TradingView, the VIRTUAL price showed a steady bearish trend. It started at 0.72667 but took a nosedive, closing at 0.66353. That’s a sizeable 8.69% fall in one day. 

To make the outlook worse, the plunge pushes the VIRTUAL price beneath the 20, 50, and 100-day EMAs. Clearly, there is some serious selling pressure in the short term.

VIRTUAL Faces Pressure Below Key Moving Averages

Source: TradingView

This downturn from the mid-May high around 0.95000 shows a strong push back against the recent gains, sending prices to revisit key April support levels. 

The VIRTUAL price action weakens momentum indicators too; the daily 14-day RSI dropped to 39.91, which is below its signal line. This suggests that sellers are still ruling the roost.

Virtuals Chooses Chainlink CCIP for Next-Gen AI Agents

The data from Virtuals Protocol further highlighted that the network switched to Chainlink CCIP, bidding farewell to its old cross-chain setup for a major security update. 

Virtuals Protocol is officially migrating to @Chainlink CCIP.

For agent infrastructure, 99% security is not enough. As part of hardening our infrastructure, we are upgrading our cross-chain stack from LayerZero to Chainlink CCIP.

We have evaluated that CCIP strengthens the… pic.twitter.com/23mOaSJcZo

— Virtuals Protocol (@virtuals_io) June 4, 2026

The team said building for autonomous AI needs way more than near-perfect security; 99% simply isn’t good enough. After considering their choices, Virtuals picked Chainlink CCIP to support their cross-chain framework and increase reliability.

The shift is aimed at advancing the protocol’s goal of becoming the go-to economic backbone for AI agents. 

By using Chainlink CCIP’s security-first framework, Virtuals wants to allow agents to handle AI inference, digital cards, emails, payments, services, commerce, and on-chain assets securely. They’ll move seamlessly across multiple blockchain networks too.

This article contains market analysis and price predictions. These are not guarantees. Crypto markets are volatile. Always DYOR. Not financial advice.

Also Read: VIRTUAL Price Targets $0.98 as Rounded Bottom Breakout Signals Rally

Filed Under: Cryptocurrency News, Altcoin News

BONK Price Prediction: Bullish Breakout Setup Targets $0.00000740 Rally

By Sadia Ali | Edited By Ammar Raza,June 4, 2026, 10:30 PM

The BONK price shows a potential bullish breakout setup as it compresses near key support, but momentum remains bearish. MACD and RSI indicate strong selling pressure and oversold conditions. Falling open interest and volume reflect weak participation, leaving direction dependent on market volatility.

At the time of writing, BONK is trading at $0.000004695 with a 24-hour trading volume of $57.48 million and a market capitalization of $413.18 million. Despite the 9.64% loss over the last 24 hours, the question is whether the BONK could maintain its support to keep the bullish momentum alive or lead to deeper corrections.

Bonk price chart

Source: CoinMarketCap

BONK Price Setup Signals Breakout to $0.00000740

The crypto analyst Sjuul further highlighted that market attention is returning to meme-driven momentum as the BONK price shows early technical signs of a potential bullish continuation. 

The BONK price action is compressing into a classic “power of three” structure, with accumulation forming around a key support zone. Traders are watching for volatility contraction that often precedes explosive directional moves.

BONK Price Setup Signals Breakout to $0.00000740

Source: Sjuul’s X Post

The critical level acts as a spark for the growth of the BONK price. Sitting above it maintains the bullish setup, while breaking out could release momentum toward the expected target for the BONK price around $0.00000740. 

This move would probably be driven by increased liquidity and fresh speculation, though overall sentiment is very responsive to broader crypto market conditions and changes in volatility.

Also Read: BONK Price Forecast: Bullish Structure Points to a Rally Toward $0.0000090

Momentum Indicators Shows Strong Bearish Dominance

According to TradingView, the MACD indicator shows a strong pick-up in bearish momentum. Mid-May saw the blue MACD line fall below the orange signal line, then dive deep into negative territory. 

This is backed by the histogram; red bars are far below zero, showing the sell-off is getting stronger as sellers stay in control.

Momentum Indicators Shows Strong Bearish Dominance

Source: TradingView

The RSI is showing strong selling pressure at 25.67, which is below the 36.34 signal line. This means the BONK price is now in oversold territory because of a big drop over several weeks. 

While an oversold RSI could suggest selling has gone too far, both indicators’ sharp fall points to no quick stabilization or reversal.

BONK Derivative Data Support Increasing Pressure

However, the BONK open interest fell 16.74%, ending at $4.26 million. This means there are fewer outstanding derivatives, and traders are becoming less committed. They’re closing positions, showing weaker belief in the trend and growing caution in the markets.

Momentum Indicators Shows Strong Bearish Dominance

Source: Coinglass

Trading volume fell 24.74%, ending at $12.62M. This means less busy markets and skinnier liquidity compared to before. It suggests trader turnout is lighter too. There’s probably some consolidation going on, along with hesitation about unclear price moves and short-term volatility.

This article contains market analysis and price predictions. These are not guarantees. Crypto markets are volatile. Always DYOR. Not financial advice.

Also Read: Will BONK Price Reach $0.0000070 by May End as Ledger Campaign Boosts Momentum?

Filed Under: Cryptocurrency News, Altcoin News

Key Ethereum Spot ETFs Reveal $53M Gain as BlackRock Adds ETH

By Ananthyka J | Edited By Ammar Raza,June 4, 2026, 10:00 PM

On June 3, Ethereum spot ETFs recorded a net withdrawal of $53 million, with transactions by BlackRock clients being the main driver as they sold $51.6 million in ETH, market data shows.

This shift in institutional flows of digital asset investment products has raised the attention of traders, analysts, and other blockchain market players who are continuously monitoring the changes in ETF dynamics.

ETF Flow Metrics and Market Context

Daily net flows track how much capital goes in or out of Ethereum spot ETF products and Because of this, act as an indicator of institutional sentiment. A $53M net outflow means that redemptions were higher than creations of Ethereum spot ETFs on that particular day.

Total Ethereum Spot ETF Net Inflow
Source: CoinGlass

These funds offer regulated exposure to ETH without clients having to take direct custody, which is why they have a strong appeal to wealth management and registered investment advisory firms.

Flow data is released by the issuers and is collected by crypto analytics platforms that evaluate short-term changes in the digital asset market.

Also Read: Ethereum Spot ETF Inflows Hit 5-Day Streak Near $2,200 Price

Breakdown of BlackRock Customer Activity

Among the clients of BlackRock, their ETH product was the one that saw the biggest portion of the outflows with a total of $51.6M, this represented most of the total redemptions of the ETF for the time of the day.

Although single-day changes indicate a certain tactical shift in the allocation, portfolio rebalancing or meeting of the liquidity needs, they do not by themselves confirm the longer-term.

🚨𝗝𝗨𝗦𝗧 𝗜𝗡:🇺🇸 Ethereum spot ETFs recorded a net outflow of $53M on June 3.

BlackRock clients sold $51,600,000 worth of ethereum:native .🔴 pic.twitter.com/vmVsJcEYg4

— DustyBC Crypto (@DustyBC) June 4, 2026

Institutional participation in spot Ethereum spot ETFs has risen since the approval, and this has been a factor that integrates the blockchain sector into the mainstream financial system in close proximity to the products related to the Bitcoin ETF.

Also Read: Harvard Endowment Exits Ethereum ETF, Reduces IBIT Holdings by 43%

Ethereum and Digital Assets Implications

The major benefit of the situation is that it enhances the transparency of institutional activity through publicly available Ethereum spot ETF data. This is a great help in getting a better understanding of the market structure. Interpreting volatility is very difficult.

If the market has outflows it may be simply risk management and not a reflection of the fundamental views of the investors on Ethereum’s network upgrades or the growth of the DeFi ecosystem. Other major macroeconomic factors like Treasury yields and general economic conditions also affect allocation decisions.

This article contains market analysis and price predictions. These are not guarantees. Crypto markets are volatile. Always DYOR. Not financial advice.

Also Read: Ethereum ETF inflows Surge Past $356 Million After Months of Outflows Return

Filed Under: Ethereum (ETH), Cryptocurrency News

XLM Price Could Surge to $5 After MoneyGram Stablecoin Launch

By Sadia Ali | Edited By Ammar Raza,June 4, 2026, 9:30 PM

Stellar (XLM) is gaining bullish momentum after a strong breakout ended months of weak trading for the XLM price, while growing adoption received a boost from MoneyGram International launching its MGUSD stablecoin on the Stellar blockchain for faster cross-border payments.

At the time of writing, XLM is trading at $0.2147 with a 24-hour trading volume of $786.79 million and a market capitalization of $7.23 billion. Despite the 2.51% loss over the last 24 hours, the XLM price structure and network growth point to a bullish reversal.

XLM Price Chart

Source: CoinMarketCap

XLM Price Setup Sparks Hope for a Move Toward $10

According to the crypto analyst Crypto Patel, the XLM price has remained unusually quiet for years, trading in long consolidation while broader crypto markets moved through multiple cycles. 

Traders often misread this kind of prolonged silence as weakness, but historically, extended compression phases can precede sharp volatility when liquidity returns and attention rotates into overlooked altcoins during stronger market conditions.

XLM Price Setup Sparks Hope for a Move Toward $10

Source: Crypto Patel’s X Post

Some analysts now argue the XLM price could be positioning for a cycle breakout if altseason materializes again, with highly speculative long-term targets ranging from $5 to $10 circulating in trading communities. 

While far from guaranteed, such projections reflect aggressive bullish cycle expectations, where dormant assets suddenly reprice when momentum, sentiment, and capital inflows align rapidly.

Also Read: Stellar Price Prediction: Could XLM Maintain Its Recovery Toward $11?

XLM Price Structure Reveals Decreasing Strength

According to TradingView, the XLM price stayed in a long downtrend, trapped in a stubborn consolidation period below its key EMAs. The XLM price struggled to gain traction, keeping momentum weak. 

This pushed the price to hit a low of about 0.14150 in mid-May. During that time, the MACD showed almost no buying pressure by moving toward the zero line.

XLM Price Structure Reveals Decreasing Strength

Source: TradingView

In late May, market dynamics shot up, breaking all EMAs and hitting nearly 0.30000. Soon after, a quick flip sent the XLM prices sliding to 0.21380, which is a 3.81% drop for the session. This created a wave of volatility, triggering a bullish MACD crossover that jumped into positive territory.

Stellar Powers MoneyGram’s New MGUSD Stablecoin

The data from Stellar further highlighted that MoneyGram launched MGUSD, their new U.S. dollar-backed stablecoin on the Stellar network. This extends their services into blockchain tech for payments. MGUSD is made to fit right into MoneyGram’s existing financial tools. 

This leads to quicker, cheaper, and more efficient cross-border payments. Additionally, it makes things easier for users and businesses globally.

Stellar Powers MoneyGram’s New MGUSD Stablecoin

Source: Stellar’s X Post

Built on Stellar’s speedy, affordable foundation, MGUSD strives for simpler international money transfers with quick settlement and better transparency. 

The launch shows that stablecoins are gaining traction with traditional finance companies. This happens as blockchain tech gets more mainstream in global payment systems and new digital financial setups worldwide.

This article contains market analysis and price predictions. These are not guarantees. Crypto markets are volatile. Always DYOR. Not financial advice.

Also Read: XLM Price Rally Cools After TD Sequential Flashes Sell Signal

Filed Under: Cryptocurrency News, Altcoin News

Injective (INJ) Price Analysis: Elliott Wave Structure Points Toward $13.17

By Tina Fatima | Edited By Ammar Raza,June 4, 2026, 9:00 PM

Injective (INJ) price shows a strong bullish recovery after a prolonged downtrend, forming a clear Elliott Wave structure. Momentum is cooling near key resistance, while RSI and MACD indicate consolidation. Despite short-term weakness, institutional adoption through a regulated fund supports long-term growth and strengthens overall market confidence.

INJ Price Strong Recovery After Downtrend Phase

The Injective (INJ) price chart shows a strong bullish recovery after a prolonged downtrend, forming a clear Elliott Wave impulse structure.

Price rallied from the $2.3 base into a 5-wave advance, now trading near $5.75, suggesting momentum is cooling as it approaches major resistance around $7.15.

According to the crypto analyst MCO Global DE, Key Fibonacci resistance levels are placed at $7.15 (38.2%), $9.70 (50%), and $13.17 (61.8%), indicating potential upside targets if bullish strength continues.

INJ price prediction chart
Source: @morecryptoDE

However, these zones also act as heavy supply areas where profit-taking may trigger volatility or rejection in short-term price action.

On the downside, retracement support lies between $5.00 and $4.45, with deeper protection at $3.96 and $3.36.

The setup remains bullishly intact as long as prices are above the rising trendline. However, a small dip probably will happen before another big jump up.

Also Read: INJ Price Prediction: Bullish Momentum Signals an Explosive Move to $60

Mixed Momentum Suggests Possible Breakout Ahead

Right now, RSI is at 53.98, and the moving average is 68.22. This signals that the bull run is cooling off after being overbought, according to the TradingView chart.

Prices indicate a consolidation phase too. Buyers are around, but their upswings are getting weaker as prices hit the resistance zone.

INJ TradingView Chart
Source: TradingView

The MACD suggests we’re still in bullish territory. The histogram is close to balanced, with the MACD line at 0.55310, not far from the signal line at 0.55340.

The histogram shows -0.00030. So the trend is up, though it’s slowing down. This could mean a brief pause, followed by another push in one direction or the other soon.

Regulated INJ Fund Launches Across Asia

Despite the price action, Merkle Capital launched M-INJ, Asia’s first regulated INJ fund, built on Injective. This gives local investors a legit way to get into INJ.

Plus, it lets them ride the INJ wave within a regulated structure. INJ is now available through mainstream institutions, marking a big step for Injective in traditional finance.

The regulated fund opens doors for pro investors, bumping up liquidity, credibility, and ongoing involvement in Injective’s booming global network.

This article contains market analysis and price predictions. These are not guarantees. Crypto markets are volatile. Always DYOR. Not financial advice.

Also Read: INJ Price Prediction: Can It Break Resistance and Surge Toward $22?

Filed Under: Altcoin News, Cryptocurrency News

TRX Price Pulls Back After May Rally: Can Institutional Buying Trigger a New High?

By Usman Zafar | Edited By Ammar Raza,June 4, 2026, 8:30 PM

TRON (TRX) reversed from a strong bullish trend into a sharp correction after recent highs, with momentum weakening for the TRX price as RSI fell near oversold levels. Trading activity increased with higher volume and open interest, while Tron Inc. continued accumulating TRX, reinforcing long-term confidence despite market pressure.

At the time of writing, TRX is trading at $0.3276 with a 24-hour trading volume of $777.98 million and a market capitalization of $31.06 billion. Despite the 1.37% loss over the last 24 hours, the TRX price structure and continued institutional accumulation point to a bullish reversal.

TRX Price chart

Source: CoinMarketCap

TRX Price Structure Point to Increasing Bearish Power

According to TradingView, the TRX price shows a clear, dramatic transition from a strong multi-month bullish trend into a sharp, aggressive correction. 

After climbing steadily from $0.27400 to a peak near $0.37500 by late May, the TRX price sharply reversed. It plunged through the 20 and 50-day EMAs, down 1.55% to $0.32764, currently testing the 100-day EMA support level.

TRX Price Structure Point to Increasing Bearish Power

Source: TradingView

The 14-period Relative Strength Index shows this sudden change in momentum. After reaching overbought levels above 80.00 during the May peak, the RSI dropped below its yellow signal line, diving straight down. Now it’s at 32.96, right above the oversold threshold, which confirms the speed of the recent market sell-off.

Also Read: TRX Price Holds Key Support as Bulls Eye a Potential Rally Toward $3 Target

TRX Derivative Data Point to Improving Sentiment

However, the TRX open interest shot up 7.16%, hitting $300.90 million. This shows more derivatives action, greater engagement, and more speculation too. Looks like traders feel good about the market, and maybe a strong trend is forming.

TRX Derivative Data Point to Improving Sentiment

Source: Coinglass

Trading volume went up by 2.30%, hitting $252.40M. This shows more people are involved in the market, there’s better liquidity, and there’s more trading going on. So, it looks like investors are more interested and are engaging more in the short term.

Tron Inc. Boosts TRX Treasury With 147,106 Token Purchase

The data from Tron Inc. further highlighted that the company has boosted its digital currency reserves through the acquisition of 147,106 TRX tokens for an average cost of $0.3399. The new acquisitions show the long-term investment of the company in the Tron network.

Tron Inc. Boosts TRX Treasury With 147,106 Token Purchase

Source: TRONSCAN

Through this latest acquisition, Tron Inc. owns more than 698.7 million tokens. The firm continues to remain committed to building up its Digital Asset Treasury (DAT) initiative with a view towards achieving long-term value for shareholders through consistent investment and exposure to blockchain finance networks.

This article contains market analysis and price predictions. These are not guarantees. Crypto markets are volatile. Always DYOR. Not financial advice.

Also Read: TRX Price Eyes $0.366 Breakout as Inverse Head and Shoulders Pattern Forms

Filed Under: Cryptocurrency News

  • « Go to Previous Page
  • Page 1
  • Interim pages omitted …
  • Page 36
  • Page 37
  • Page 38
  • Page 39
  • Page 40
  • Interim pages omitted …
  • Page 3698
  • Go to Next Page »

Primary Sidebar

Recent Posts

  • JP Morgan Predicts $1.2T Equity Issuance Rise Due To AI Costs June 17, 2026
  • Bitmine Expands Ethereum Treasury With $35.85 Million ETH Acquisition June 17, 2026
  • Bitwise Hyperliquid ETF Surpasses 1 Million HYPE Tokens in Holdings June 17, 2026
  • OKX vs CZ: Explosive Clash Over Hyperliquid Compliance 2026 June 17, 2026
  • Telegram Ban: Durov vs Reliance Blocking Claims 2026 June 17, 2026

Footer

News

  • Latest News
  • Altcoin News
  • Bitcoin (BTC)
  • Blockchain
  • Tron (TRX)
  • World

Digest

  • Meet the Founder
  • Price Winning Article
  • DeFi
  • Cyber Security
  • Crypto Scam

Industry

  • Project Review
  • Technology
  • Fintech
  • Tron Exchange
  • New in Town

Tron Universe

  • Event and Tron Parties
  • New in Town
  • Tron Tokens

FOLLOW US

  • Facebook
  • Telegram
  • Twitter
  • Linkedin

Subscribe US

Editorial Policy | Privacy Policy | Disclaimer | Terms and Conditions | Masthead

Copyright © 2026 · Tron Weekly. All Rights Reserved. NOTE: Tron Weekly is an independent crypto news site that adheres to the strict journalism policy anchored on transparency, trust, and objectivity, we have no affiliation with the TRON Foundation, its founder Justin Sun or any other cryptocurrency firm.