ZEC is drawing renewed attention as traders speculate on a potential move toward $700 after a rally and correction. The ZEC price is testing support levels while momentum weakens. Declining volume and open interest suggest reduced participation, with future direction depending on liquidity and buying pressure.
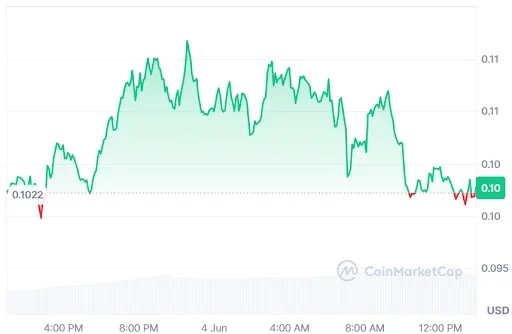
At the time of writing, ZEC is trading at $537.49 with a 24-hour trading volume of $1.34 billion and a market capitalization of $8.96 billion. Despite the 12.87% loss over the last 24 hours, the TRX price structure points to a bullish reversal ahead.
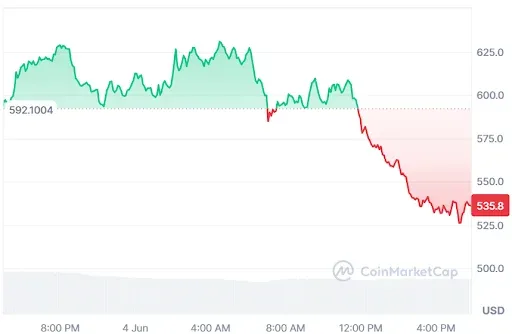
Source: CoinMarketCap
ZEC Price Action Points to a Move Toward $700
Furthermore, the crypto analyst Sjuul pointed out that the ZEC price chart has become the center of renewed trader attention after claims emerged from market participants who say they repeatedly entered positions just before multiple upward price movements.
These assertions, backed by posted timestamps and chart snapshots, suggest unusually well-timed trades ahead of short-term rallies, intensifying discussion across crypto communities and boosting speculative interest in the asset.
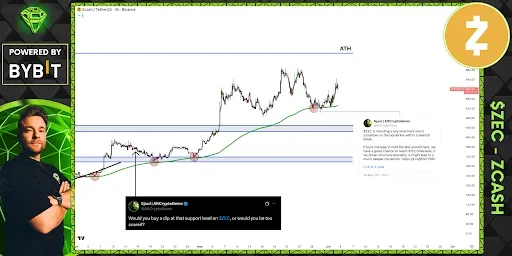
Source: Sjuul’s X Post
Traders are focusing on a potential breakout for the ZEC price, particularly around the $700. Bullish sentiment is rising, and there are assurances being provided; however, these types of privacy coins have often had very high levels of volatility due to developments in market sentiment.
Whether the bullish momentum for the ZEC price will continue depends largely on whether there is adequate liquidity within the overall crypto market.
Also Read: ZEC Price Analysis: $500 Support Level Becomes Make-or-Break Zone for Bulls
Technical Indicators Point to a Short-Term Pressure
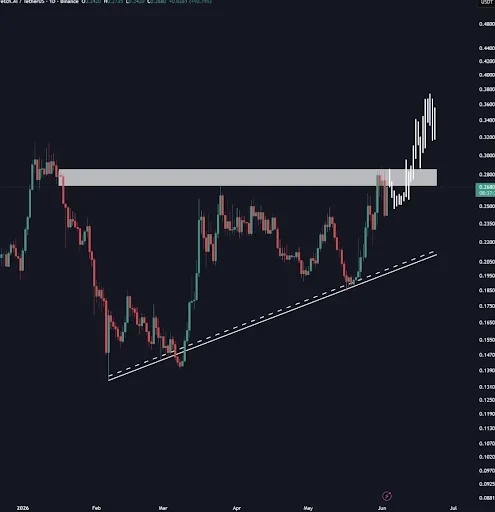
According to TradingView, the ZEC price shows a strong uptrend that began in April, but it’s now having a big correction. The ZEC price went above $600.00 after some consolidation in March.
However, there is a steep 13.44% drop to $536.59 recently, showing heavy selling and quick profit-taking at crucial resistance levels.

Source: TradingView
The price dipped under the 20-day EMA but stays above the 50-day, 100-day, and 200-day EMAs. Right now, it’s sitting on top of the Ichimoku cloud support at $536.59. Staying in this zone is key for keeping things bullish overall. If it fails, there might be a drop towards those long-term moving averages.
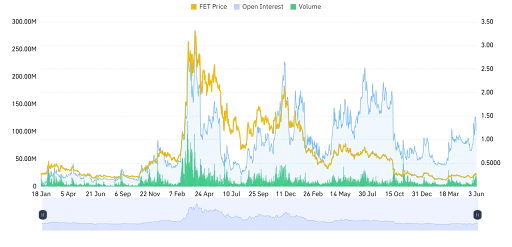
ZEC Derivative Data Point to Cautious Optimism
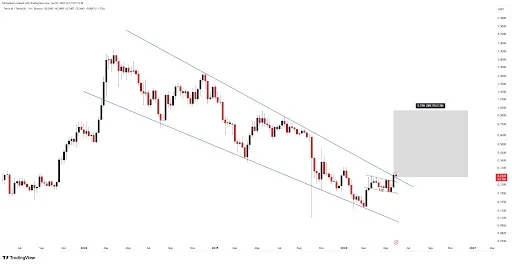
However, the ZEC trading volume dropped 3.53%, now at $6.23 billion, showing less market action than before. This indicates possible slowing in participation or short-term pressure

Source: Coinglass
Open interest dropped by 17.91%, hitting $1.23 billion. This shows less trading in derivatives and weakened speculation. It might mean traders have lost faith or their sentiments are changing.
This article contains market analysis and price predictions. These are not guarantees. Crypto markets are volatile. Always DYOR. Not financial advice.
Also Read: ZEC Price Forecast: Can It Rally Toward $1,050 After Recent Correction?