The Ethereum Treasury strategy is driving a major capital expansion as BitMine Immersion Technologies moves to raise $300 million through a preferred stock offering. The company is leveraging dividend-paying securities to secure new funding while continuing aggressive Ethereum accumulation during ongoing volatility in crypto markets.
According to an SEC filing, BitMine plans to issue 3 million Series A perpetual preferred shares at a stated value of $100. The securities carry a 9.5% annual dividend, payable weekly in cash, subject to approval. The preferred stock is expected to list on the NYSE under the ticker BMNP, with approval status pending.
Also Read | US Treasury Expands Economic Fury Sanctions on Iran’s Major Crypto Exchanges
Ethereum Treasury Expansion Through Preferred Stock Financing
BitMine is pursuing a financing model similar to Strategy, formerly known as MicroStrategy, which raised capital for Bitcoin purchase through preferred equity. Other crypto treasury companies like Strive and Metaplanet have also resorted to dividend-paying securities while diversifying their funding sources amid a combination of weak digital asset prices and tighter liquidity in the global financial markets.
Led by Fundstrat co-founder Tom Lee, BitMine has accumulated more than 5.3 million ETH, positioning itself near a 5% share of the total Ethereum supply. The company’s share of the total Ethereum supply is almost 5%. As a part of its long-term treasury strategy, BitMine is continuing heavy buying of Ethereum in order to increase its exposure not only to the Ethereum network but also to the institutional digital asset markets expansion phase.

BitMine Holds 5.3 Million ETH
Company disclosures indicate that BitMine owns more than 5.3 million ETH worth almost $10 billion. At the same time, it also states a staggering $9 billion unrealized loss due to the significant drop in Ethereum from its recent peaks. The position highlights significant exposure to price volatility, which directly influences investor sentiment toward its preferred stock financing strategy as a whole.
BitMine recently purchased 26,497 ETH, increasing total holdings to 5.42 million tokens. BitMine has a variety of assets, including Bitcoin and cash reserves, as well as equity stakes.
The combined crypto and investment holdings stood at $11.6 billion, a figure that mirrors an upscaling balance sheet strategy geared to aid Ethereum treasury acquisition and offer broader digital asset exposure through institutional portfolio growth.
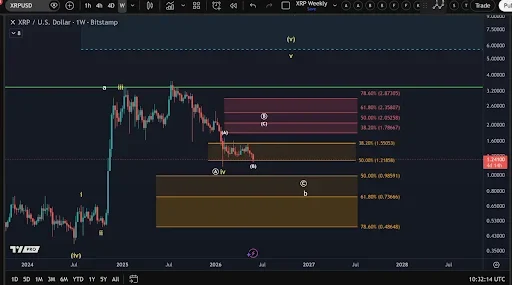
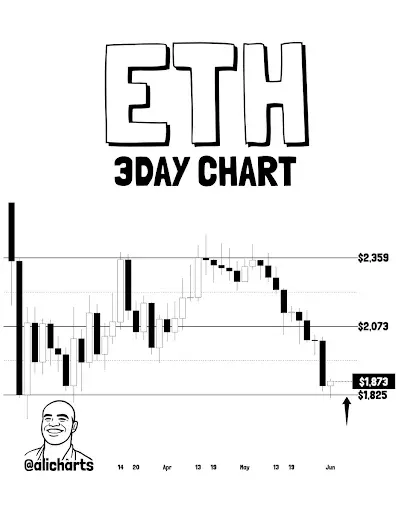
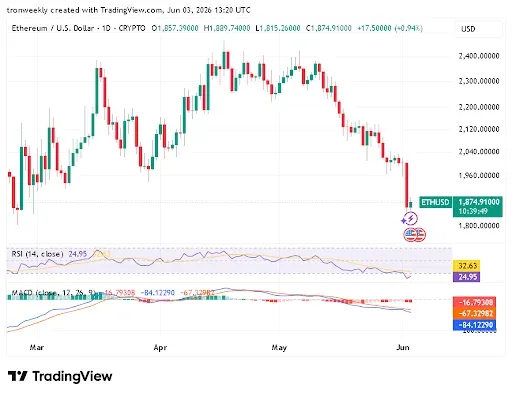
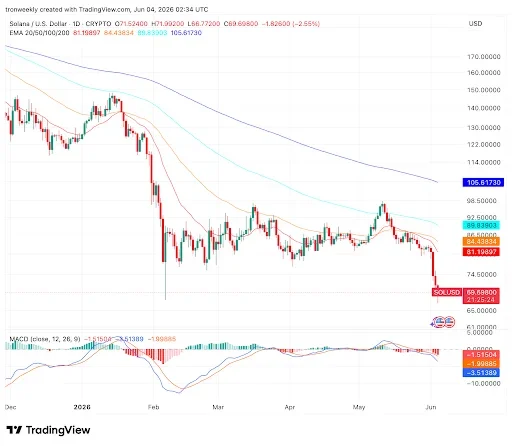
Meanwhile, Ethereum is currently trading at $1,804. It has a daily volume of over $33 billion but has been losing momentum based on the short-term forecast.

Other crypto treasury firms have had their preferred shares fall below par, an indication that investors are becoming more wary of leveraged Ethereum Treasury Strategy models in uncertain market environments.
Also Read | Meta Launches Paid AI Agent for Enterprise Business Messaging Services