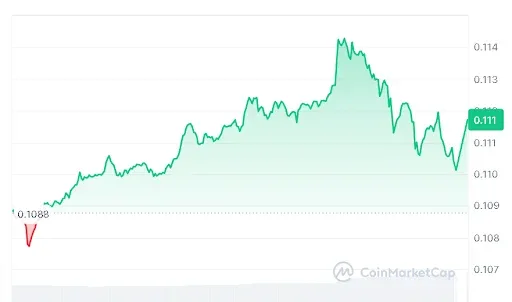
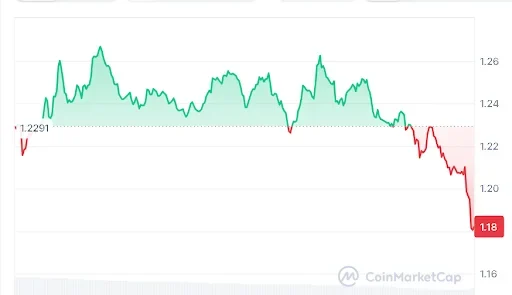
XRP ETF activity showed renewed strength as market data highlighted $12.27 million in trading volume with nearly 1 hour and 45 minutes remaining before the close.
The early selling across various funds was countered by buying interest, which helped to push prices higher. According to market participants, the intraday liquidity had remained strong as there was a balance in the book, ensuring that prices did not have extreme fluctuations.

Source: X
The trader explained that such moves are usually indicative of trading activity in advance of an eventual trend in the cryptocurrency market. The XRP also held its own amid stronger moves in the market environment.
Also Read: XLM Price Forecast: Can Bulls Trigger a Recovery Rally Toward $0.328?
XRP ETF Momentum and On-Chain Growth Trends
Meanwhile, Santiment Intelligence on-chain data demonstrates the increased presence of users on the XRP ledger. It is reported that the number of addresses containing at least 10,000 XRP has reached a record level of 332,230 wallets.
The consistent upward trajectory implies that even when there are fluctuations in the price, the large players continue buying. The decline of 4,500 wallet addresses at the beginning of February can be attributed to the mass liquidation across the market rather than the lack of faith in XRP.

Source: Santiment Intelligence
Overall, XRP ETF trends align with accumulation behavior typically associated with longer holding cycles and reduced short-term selling pressure, indicating steady investor confidence.
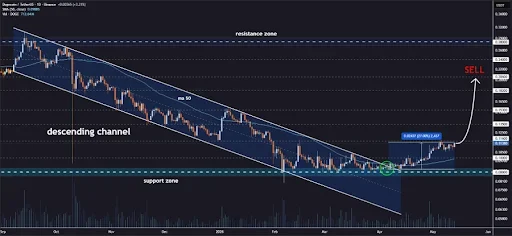
Price Structure and Key Levels in XRP ETF Market Setup
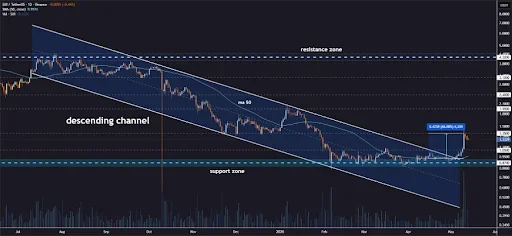
As per analysts, a weekly close above the $1.51 level is needed for more solid evidence that a breakout is taking place in the direction of XRP. The retracement from the huge low of $0.1270 to the high of $3.30 is revealing significant levels.

Source: X
Currently, the $1.54 to $1.60 range will be an important level to maintain support. Above the range of $1.30 to $1.50 will continue the positive trend toward $2.17 and $5.20 in the event of further upside.
Market Outlook Shaped by XRP ETF Positioning
Volume is used by technical traders to confirm movements, since breakouts without significant participation rarely stand for long. An XRP breakout above its resistance line, if accompanied by strong buys, would indicate the beginning of an impulsive movement.
The present XRP ETF structure indicates that the asset is currently in consolidation mode, where buyers are trying to defend their levels while sellers are taking profits. This will continue until there is an actual breakout.
This article contains market analysis and price predictions. These are not guarantees. Crypto markets are volatile. Always DYOR. Not financial advice.
Also Read: Fidelity International Launches Tokenized Liquidity Fund With Chainlink Integration