
- Bitcoin breaks above $121K, setting sights on resistance levels at $131K, $144K, and $158K.
- Bull flag breakout and rising channel suggest a sustainable uptrend mirroring late 2024 patterns.
- On-chain data and Fibonacci levels support bullish momentum; $140K seen as next major target.
Bitcoin (BTC) is in the limelight again after staging a strong rebound, which is a probable breakout after weeks of market fluctuations. With the leading crypto rising alongside the broader crypto market, both retail and professional investors are once again targeting Bitcoin positively.
The latest price movements suggest that BTC is possibly in a bull market, which is driven by tech patterns, sentiment, and an excellent macroeconomic backdrop.
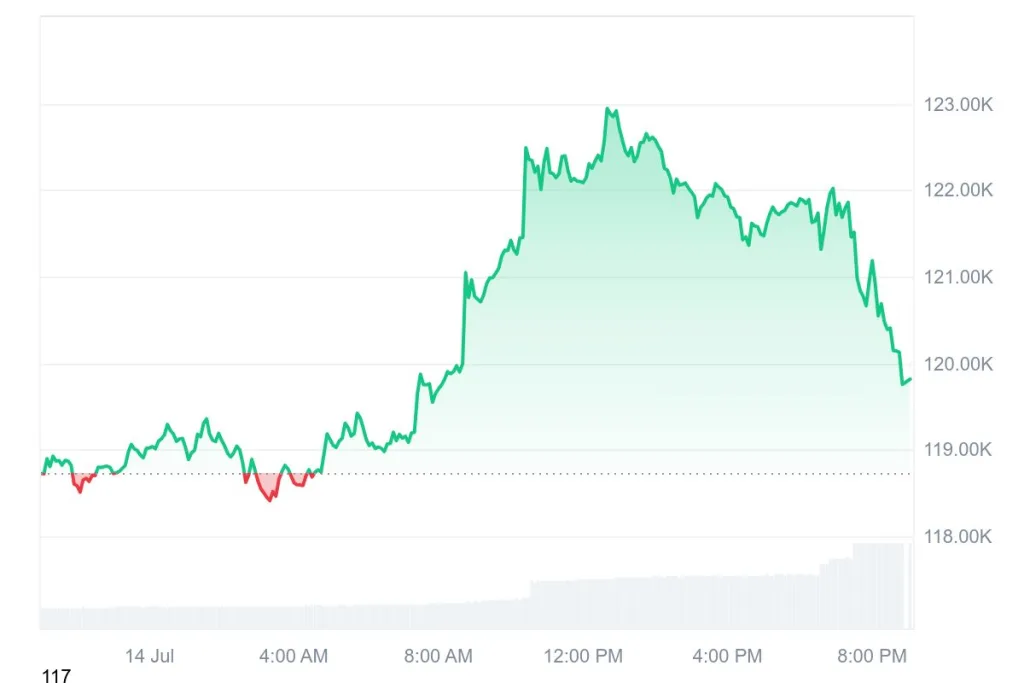
At the moment we write, the value of Bitcoin is at $119,815, which marks a 24-hour appreciation of 0.92%. Volume for 24 hours is at $69.94 billion, and the market cap surged to an all-time high of $2.39 trillion. This is after a prolonged span where volatility was very high, and the ambiguity in the economy alongside a shift in sentiment on investors’ part made Bitcoin hover in a very tight range.
On-chain analyst Ali Martinez pointed out on X (formerly Twitter) that Bitcoin busted through a parallel channel and was successful in reaching the initial price target at $121,000. The subsequent important resistance areas, in Martinez’s opinion, are $131,000, $144,000, and $158,000, which is a clear template for an eventual broader Bitcoin uptrend.

The areas are consistent with Fibonacci retracement locations and price history, which is technical confirmation for the rally’s strength.
Bitcoin Eyes $140,000 as 2024 Pattern Repeats
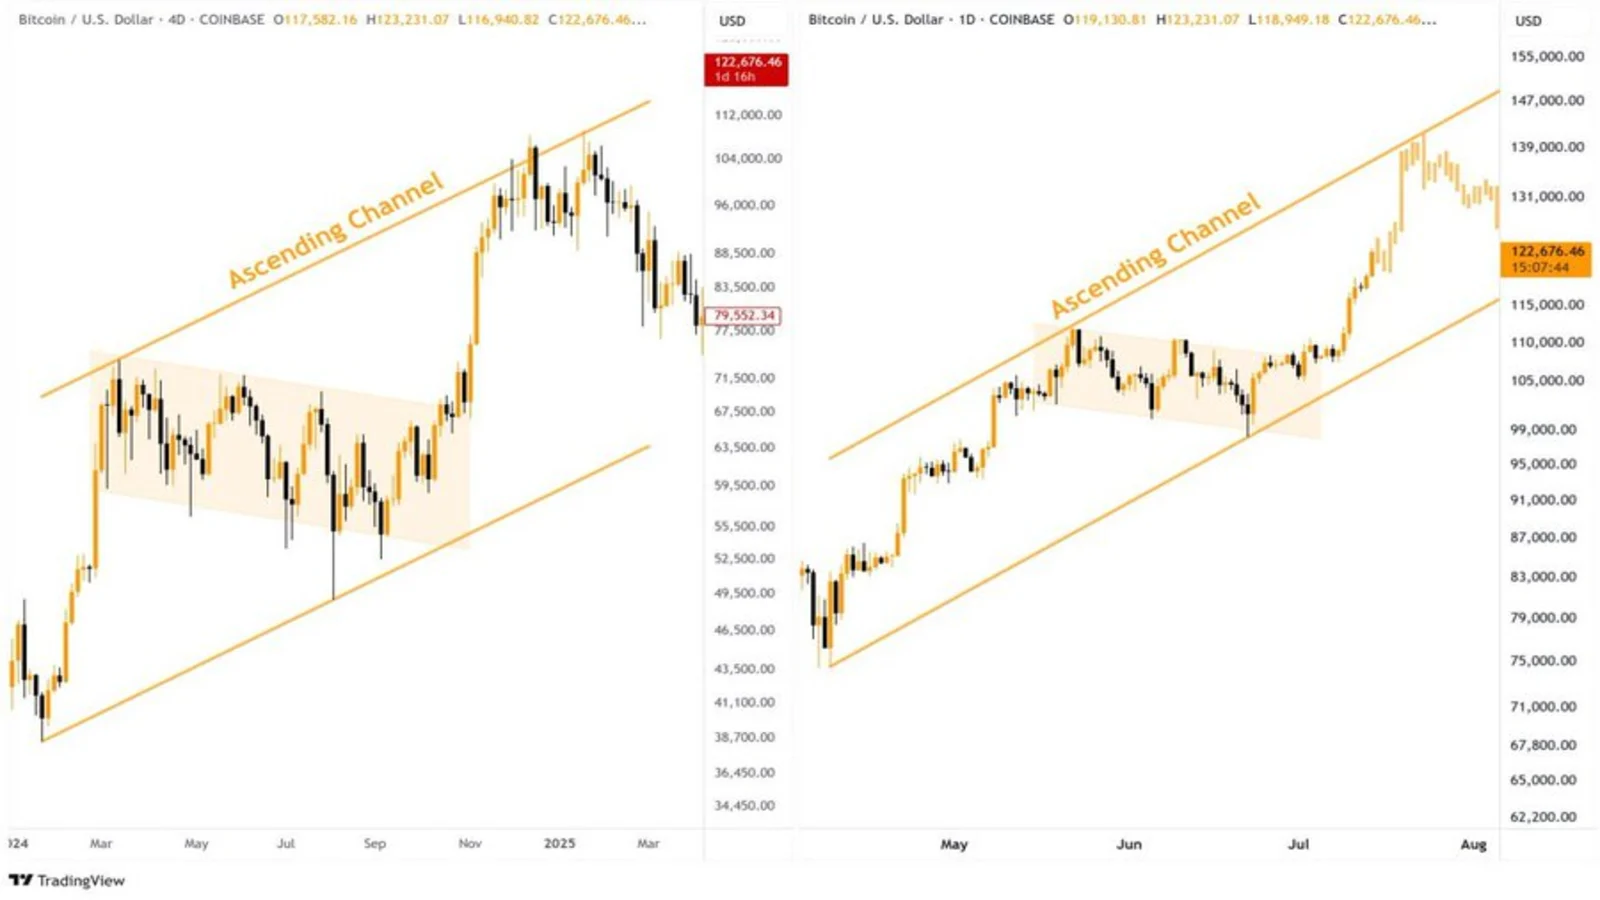
Adding further weight to the bullish outlook, well-known crypto trader Nehal pointed out striking similarities between the current BTC price structure and the chart pattern observed at the end of 2024. Nehal noted three key elements repeating:
Also Read: Bitcoin Smashes All-Time High at $123,000; Is $127,000 Next?
Bitcoin is in a definite rising channel, which respects both the upper and lower borders. The ongoing period of declining consolidation is a typical bull flag formation. The bull flag breakout suggests the beginning of a sustainable rising movement toward the higher resistance line of the channel.
Nehal is foretelling a target area of roughly $140,000 in the next big move for BTC, based on this fractal formation. If history is to repeat, such a level could be a significant marker before BTC pushes for yet higher targets, possibly higher even than $150,000.
Meanwhile, broader market forces are enabling the bull case for BTC. More institutions, notably in the U.S., spot Bitcoin ETFs, which last week saw high weekly inflows, are underpinning faith in Bitcoin as a long-term hold. Retail investors are also returning, triggered by improving technicals and rising media coverage.
As the price of BTC blows past $121,000 and forms bullish technical configurations, the stage is set for a surge to $140,000 and beyond. As analysts zero in on significant resistance points and historic price fractals intersect.
The next great rally leg for BTC is potentially on the horizon, an occurrence that would reshape the crypto landscape in the second half of 2025. Traders and investors are closely watching BTC, as the gains in momentum on all fronts continue.
Also Read | Bitcoin at Crossroads: $150K Breakout or $100K Crash Ahead?
Disclaimer: This article is based on real-time market data and general technical observations. It does not constitute financial advice. Always conduct your own research before making investment decisions.