Bitcoin price seems to be recovering after recapturing an important on-chain cost basis, even as short-term technical analysis continues to point to concerns.
Table of Contents
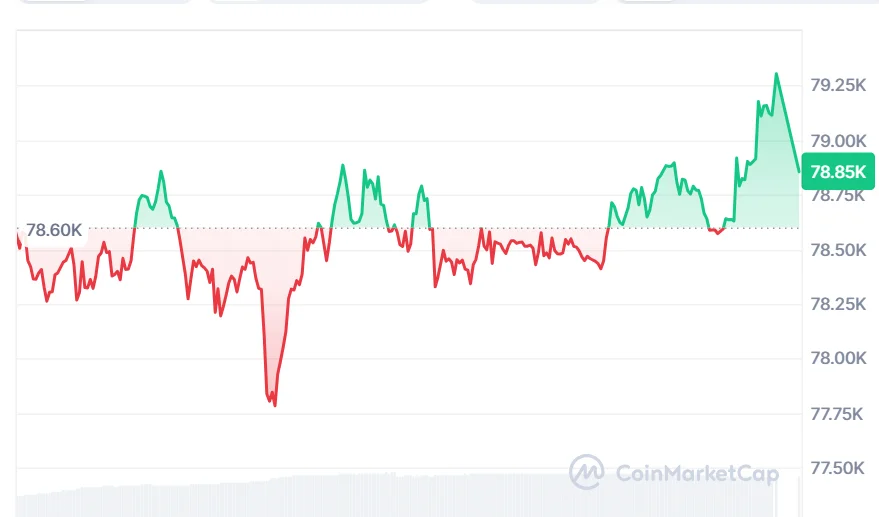
At the time of writing, BTC is trading around $78,856, up 0.53% over the last 24 hours, with daily trading volume near $146 billion and a market capitalization of approximately $1.59 trillion.
Bitcoin Price Targets Bigger Rally
A well-known crypto analyst, Ali Martinez, pointed out on September 9 that BTC had once again returned to its warm supply realized price. This price represents the average price at which Bitcoin was bought by those who have traded Bitcoin within the period from one week to six months ago. The figure is important, as it helps assess the position of not-so-long-term Bitcoin holders.
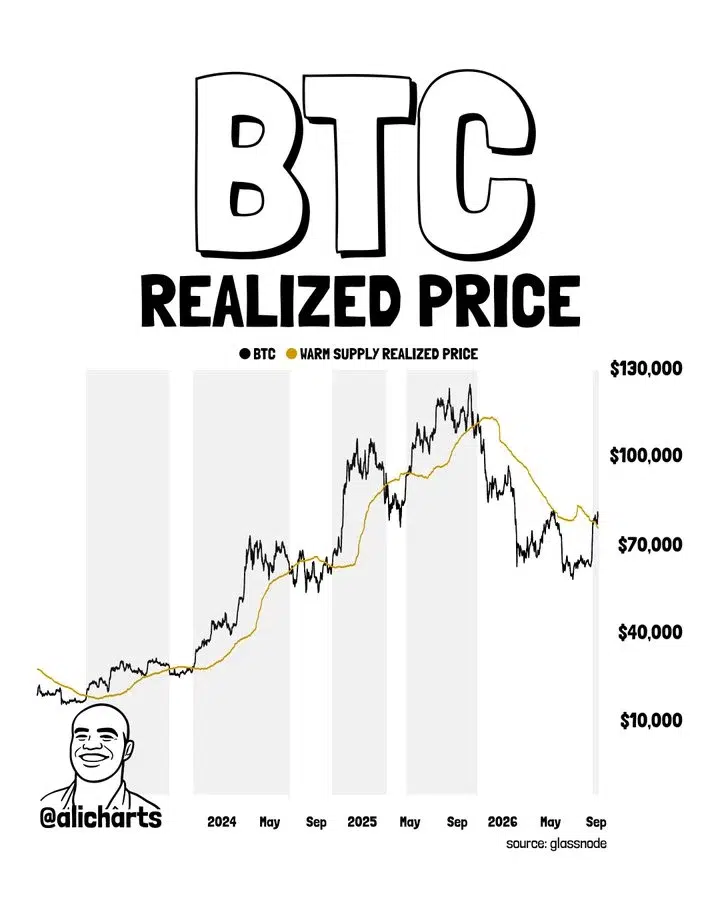
Previous significant recoveries of warm supply realized price that Martinez pointed out were associated with significant rallies in the price of Bitcoin. For instance, the January 2023 recovery was followed by a 69% surge, and the October 2023 recovery was followed by a 159% rally.
After the October 2024 recovery, Bitcoin rallied 74%, and after the April 2025 recovery, it went up by 34%. Although this history is quite promising for the future price of Bitcoin, it does not guarantee its repetition.
Also Read | Bitmine Reaches 5.93 Million ETH Holdings Valued at $14.8B
Bitcoin Price May Face Major Correction
Furthermore, another analyst, Klarck, is known for his much more conservative long-term prediction. In accordance with his market update from September 3, issued via KuCoin, his longer-term roadmap leads from $69,000 down to $40,000 as a possible cycle low before the next bull cycle emerges, with a long-term forecast at $196,000 in 2029.
Moreover, Klarck emphasized his previous forecasts regarding the 2025 cycle peak of Bitcoin at around $83,000, down to $60,000.
Bitcoin Price Faces Important Technical Test
The BTC price is now moving above the middle part of the Bollinger Bands, whose level is located at $78,729. At the same time, the upper border of this indicator stands at the level of $80,907, while the lower border is near $76,551. Moving above the middle band allows buyers to test the upper one.
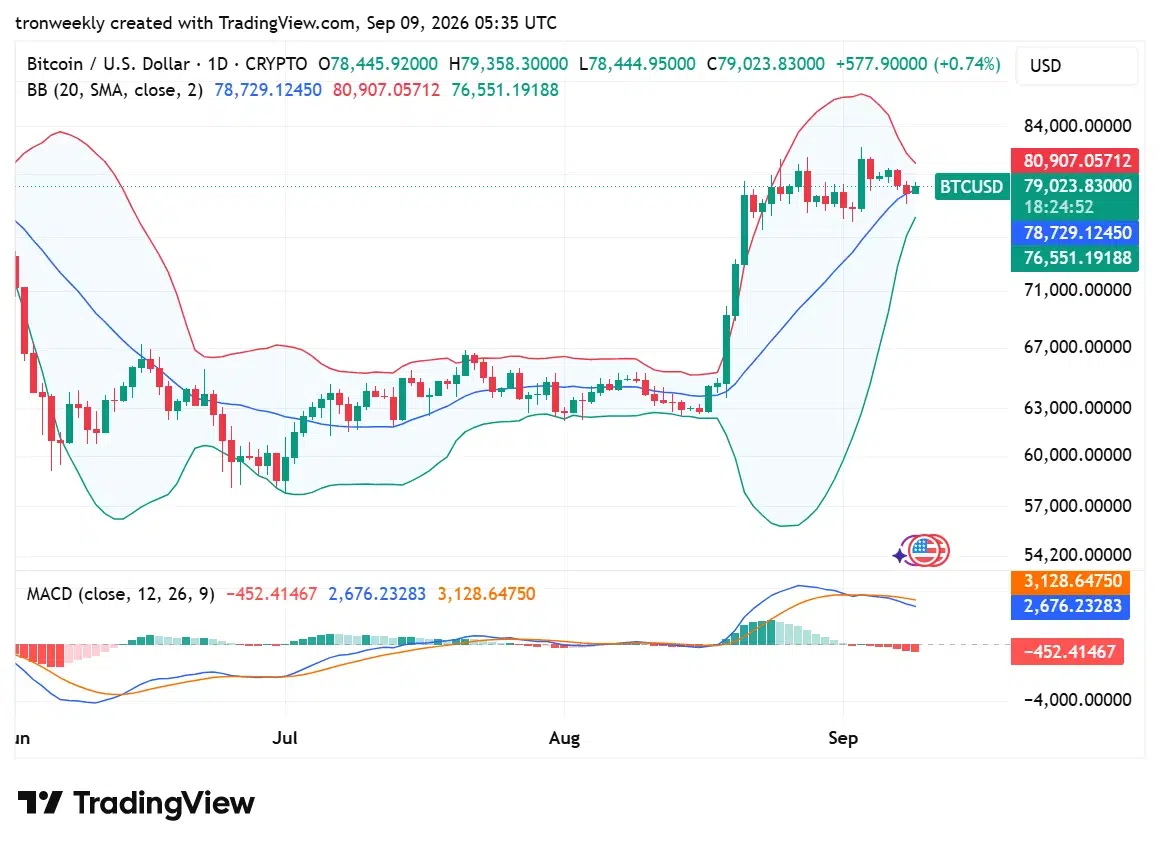
MACD is standing at -452.41, indicating that the short-term momentum is still poor. MACD line is at 2,676.23, whereas the signal line is at 3,128.65. This suggests that there is still pressure for selling in the market, but a bullish crossover may help increase momentum.
What Happens Next for Bitcoin Price
The price range between $80,000 and $81,000 is expected to play a significant role for the price of Bitcoin in the coming days. Any breakout from this range might help build positive sentiment and pave the way towards resistance. However, any loss below the $78,700 region might push BTC towards the lower Bollinger Band at $76,551.
The broader $69,000 level is also significant for the bearish cycle as seen in Klarck’s analysis. This level would be a major change in the existing recovery setup, while further strength above the support levels will make the argument for a near-term deeper pullback weaker.
This last development is positive, although previous successes with Warm Supply recovery don’t necessarily mean there will be another rally. Price strength at the top end of the range above $80,000 is needed for more upside.
Also Read | INJ Price Eyes $17 as Bullish Momentum, Staking, and Open Interest Surge