Bitcoin price remained under pressure on Thursday, September 3, 2026, after BTC rejected a key bearish order block. Traders are now monitoring the recent breakout, technical indicators, and mixed spot exchange-traded fund flows for direction.
Table of Contents
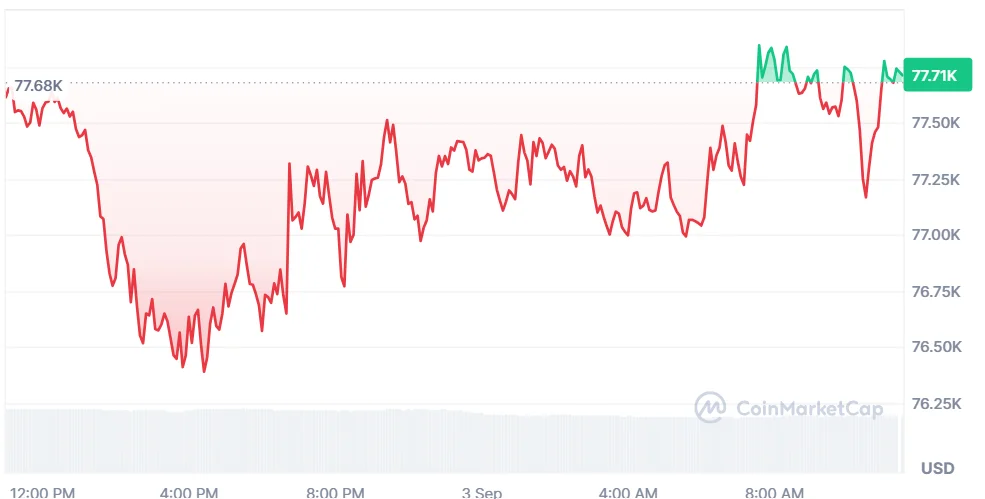
As of writing, Bitcoin (BTC) is trading at $77,739, showing an uptick of 0.31% in the past day. The 24-hour trading volume is currently standing at $27.41 billion, with a market capitalization of $1.56 trillion. Over the last week, the token has gone down by 1.24%, according to CoinMarketCap.
Also Read: Strategy Bitcoin Defends BTC Sale as Company Resumes Buying
Why Bitcoin Price Faces Deeper Losses Below $83K
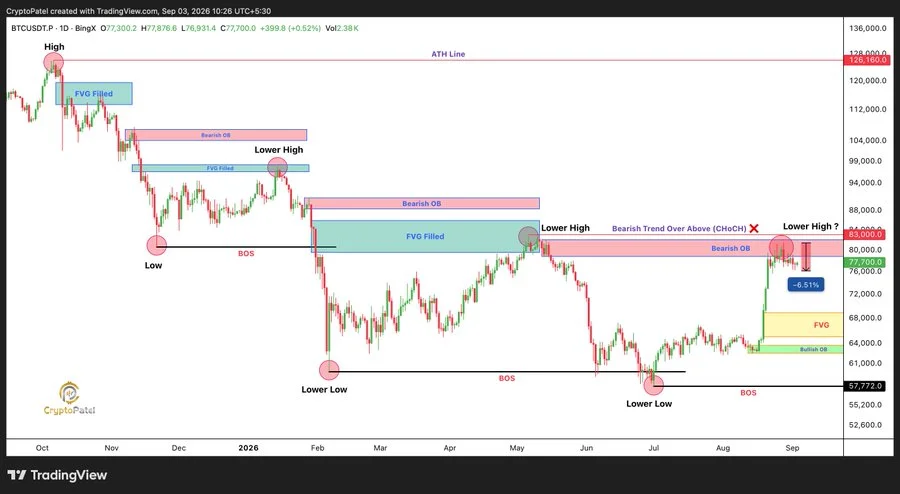
Popular analyst Crypto Patel highlighted that the Bitcoin price rejected a bearish order block between $80,000 and $83,000, marked on August 25. BTC fell from $81,500 toward $76,200, a 6.5% decline within days.
Patel said failure to reclaim $83,000 on a higher-time-frame close could expose $70,000, $65,000, and $60,000. Further weakness could bring $50,000 to $40,000 into view.
A higher-time-frame close above $83,000 would invalidate the bearish setup. It would require a fresh structural assessment of the broader trend.
Moreover, another analyst, Alex Marzell, shared a more constructive view. He mentioned that BTC broke above a months-long range between $65,000 and $70,500.
Marzell described the sequence as a liquidity sweep, fakeout, breakout, and expansion. Bitcoin price then advanced toward $78,000, placing the next major liquidity zone around $83,000 to $84,000.
Holding above $70,500 would keep the upside target active. A return to the range could turn the breakout into a fakeout.
What the Latest $101M Bitcoin ETF Inflow Reveals
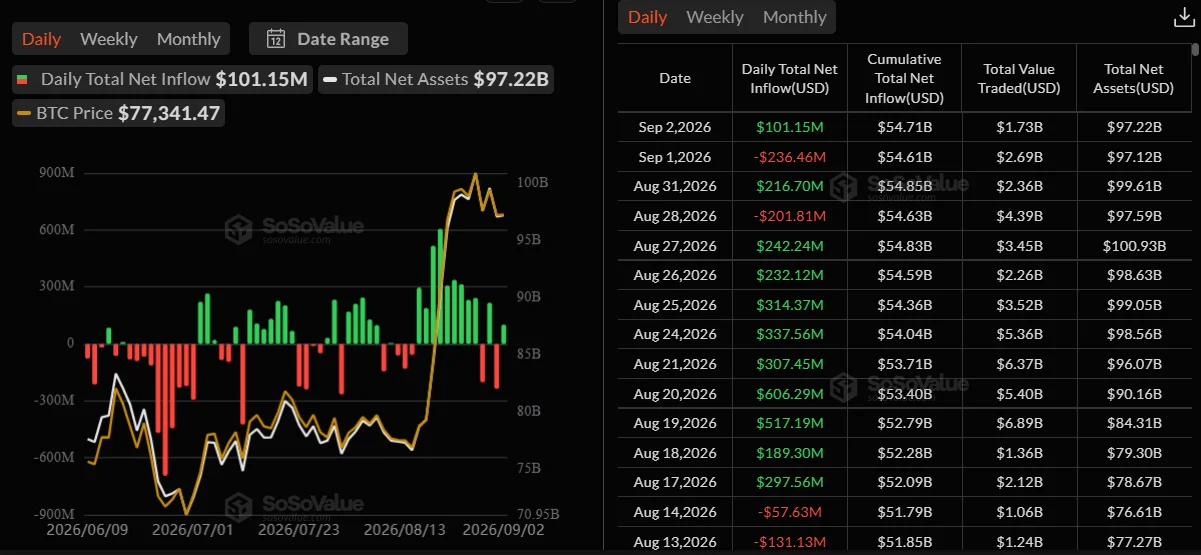
According to SoSoValue data, spot Bitcoin ETF inflows recorded $101.15 million on September 2. This comes after an outflow of $236.46 million, with cumulative inflows at $54.71 billion and total assets at $97.22 billion.
Nine positive sessions from August 17-27 drew inflows of about $3.04 billion. However, the four most recent sessions have seen net outflows of $120.42 million, with ETF trading volumes falling to $1.73 billion.
Where Bitcoin’s Key EMA and Bollinger Band Levels Stand
According to TradingView data, the 20-day Exponential Moving Average (EMA) is $74,925. Meanwhile, the 50-day EMA is at $70,555. Trading above both EMAs is a sign of positive momentum in the short term.
The 100-day EMA is $69,360, whereas the 200-day EMA is $72,384. Bitcoin is trading above both long-term EMAs. However, the averages have not formed a complete bullish alignment.
The Bollinger Band (BB) shows a middle line of $74,602. The upper band stands at $86,382, while the lower band is $62,821. Bitcoin remains above the midpoint, indicating positive momentum within a wide volatility range.
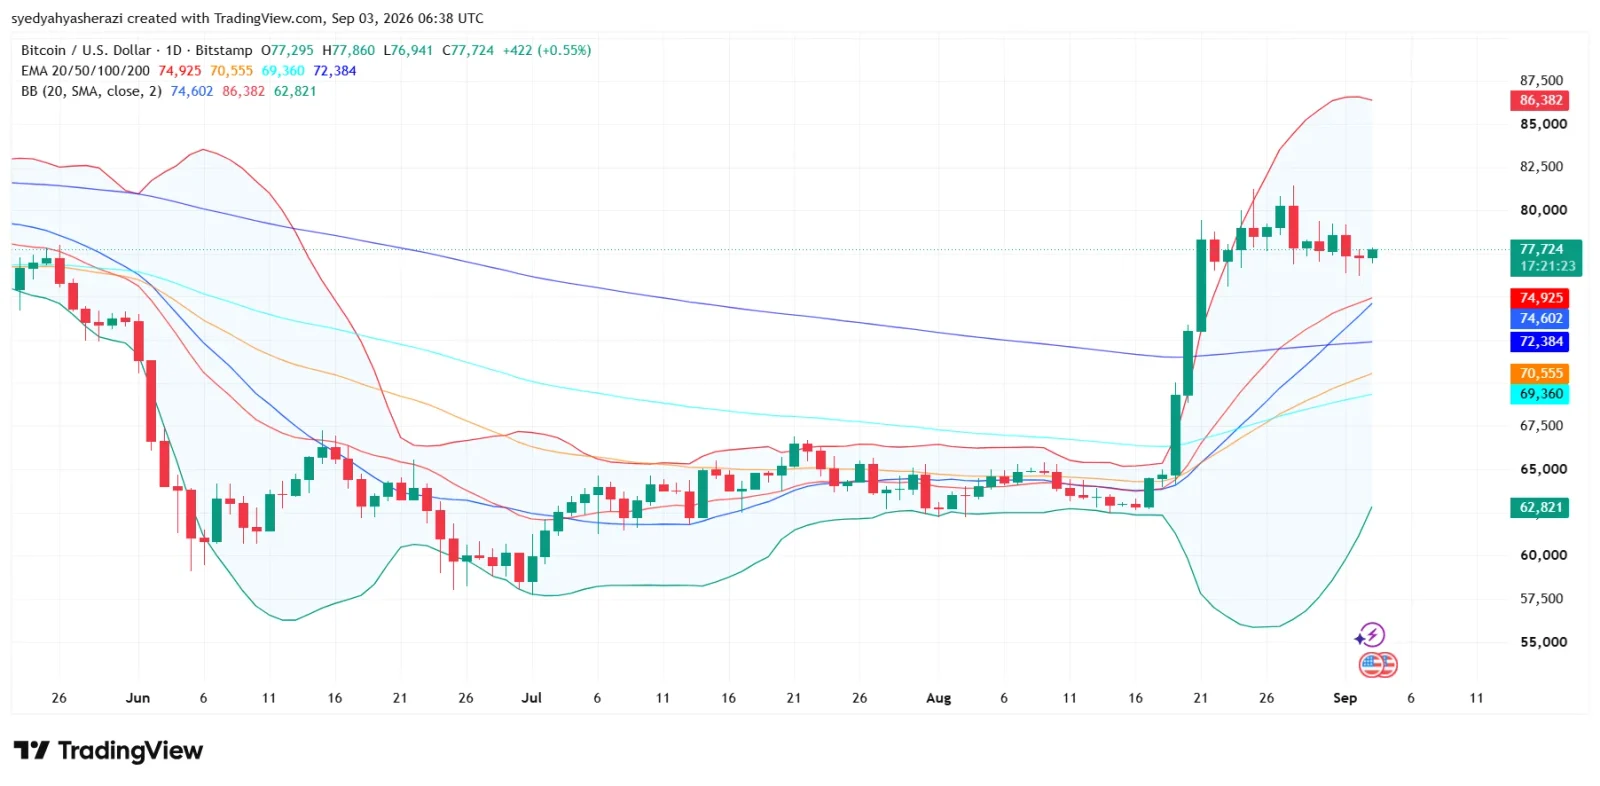
The Bitcoin price will depend on buyers defending the breakout and breaking past $83,000. Falling near-term support could add more downward pressure, while a strong close past resistance may fuel further gains.
Also Read: DOT Price Prediction: DOT Eyes $0.91 Recovery Amid Network Growth