
Bitcoin price is facing renewed selling pressure after slipping below the $76,000 level, with the market reacting to the U.S. Senate’s failure to advance the Digital Asset Market Clarity Act and a major Federal Reserve decision due later on September 16.
Table of Contents
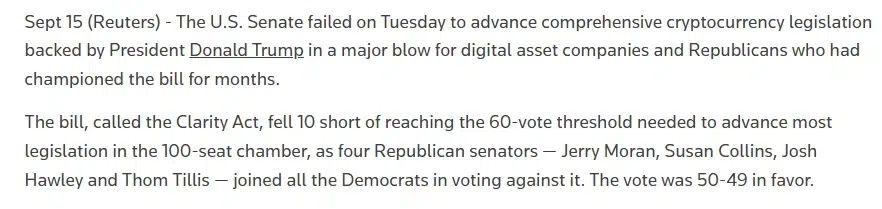
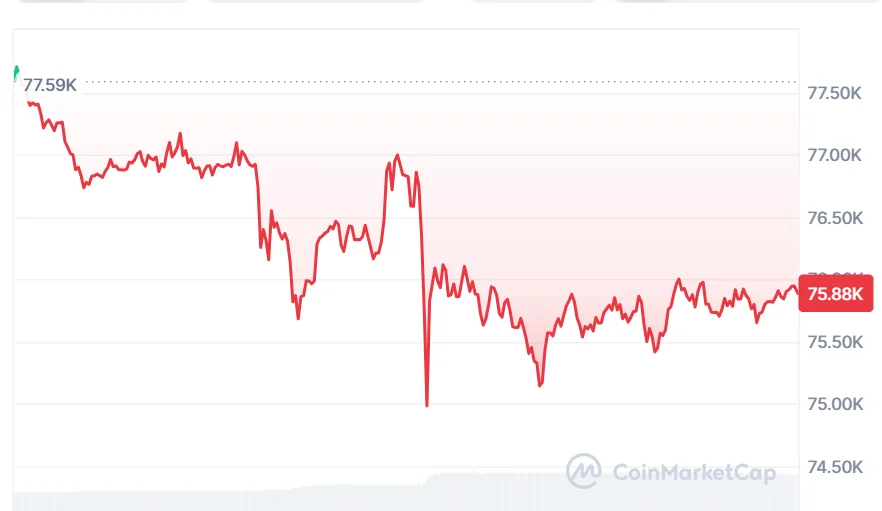
This recent fall followed Bitcoin’s inability to hold the $78,000 region and the subsequent steep fall witnessed on September 15. In light of the failure of the US Senate to advance the CLARITY Act, Bitcoin fell to an intraday low of $74,900. Reuters indicated that 50 votes were in favor of the act while 49 were against, meaning that the 60 needed were not achieved.
Also Read | House Crypto Tax Bill Proposes $10 Fee Relief and New Wash-Sale Rules
Bitcoin Price Eyes Recovery as Key Support Holds
Despite its recent drop, cryptocurrency analyst Alpha Crypto Signal sees that Bitcoin price will soon be at a critical higher time frame support zone.
According to the analysis by Alpha Crypto on September 16, the $76,000 to $71,000 range has various horizontal supports associated with the price action of Bitcoin between February and April.
Alpha Crypto Signal said that the recent price action was just a retracement and not any change in the overall structure of the market, and it was likely for Bitcoin to try a move towards $87,000.
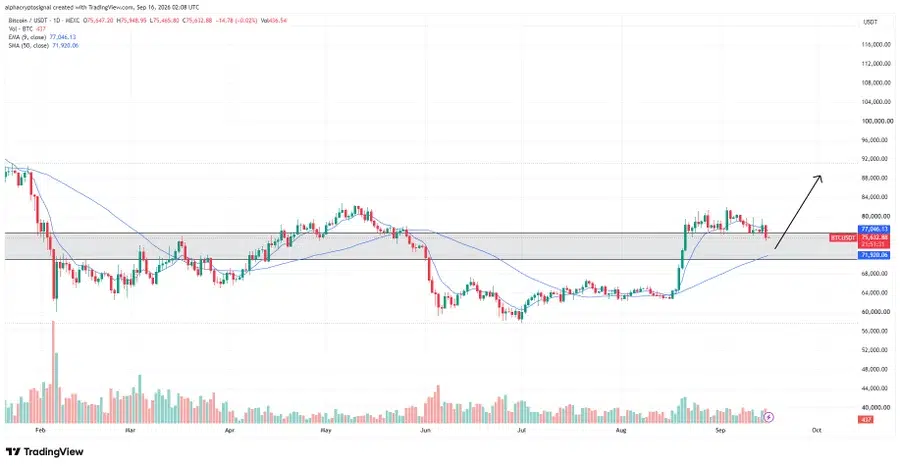
The analyst also saw $66,000 as an unlikely downside target. But if Bitcoin fails to defend the broader support region and does not manage to break above the key levels, then it will gain significance.
However, such an assessment is risky on the technical side. In earlier analysis by FXEmpire, the region between $76,000-$76,300 was seen as the key support level, and its breakdown could see Bitcoin in a move towards around $71,000.
At the time of writing, Bitcoin is trading at $75,889, with a 24-hour trading volume of approximately $135.44 billion and a market capitalization of about $1.52 trillion. Bitcoin price has declined roughly 2.08% over the last 24 hours.
Bitcoin Price Faces Pressure as Technical Signals Weaken
In Bitcoin’s Bollinger Band, the price is seen at $75,780.37, which is below the middle line at $78,071.85, while the upper and lower lines are at $80,905.58 and $75,238.11, respectively. The price is near the lower line, which indicates the presence of more selling pressure due to the recent price increase.
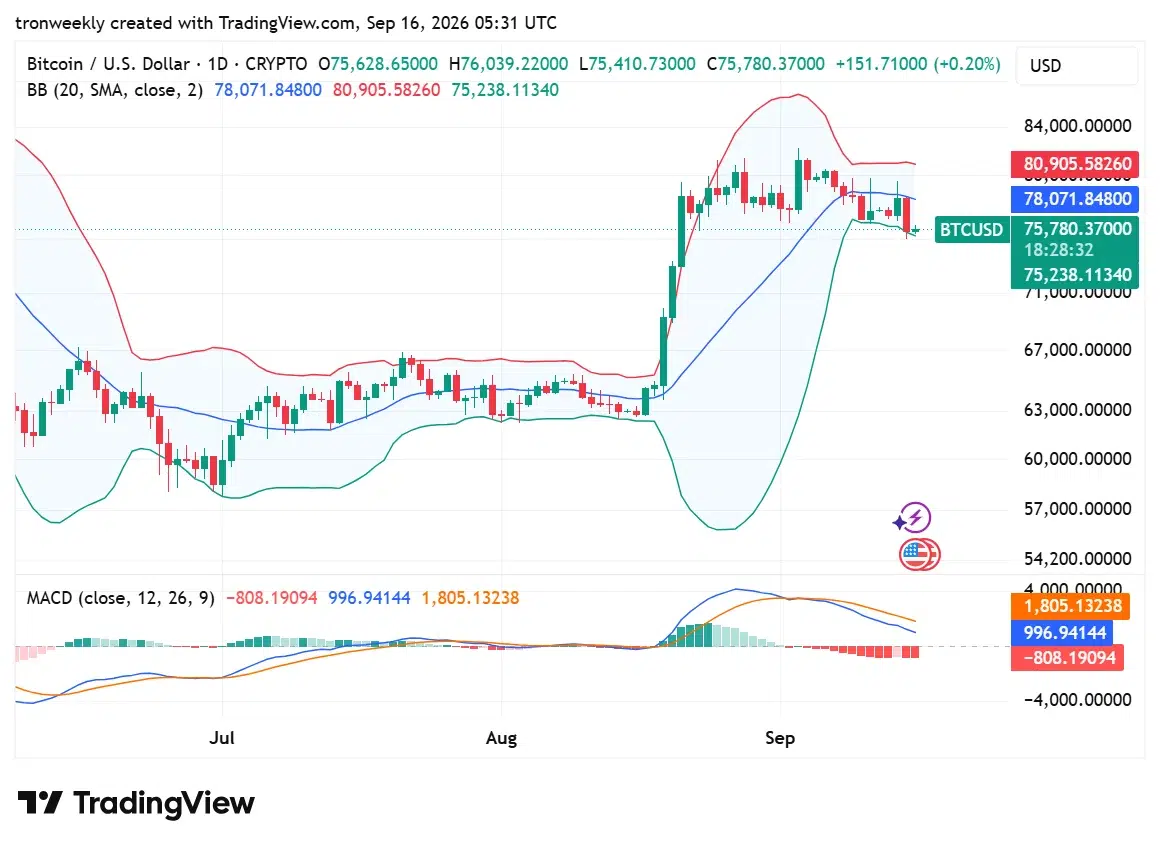
Moreover, MACD is also weakening, with the MACD line at -808.19, which is below the signal line at 1,805.13. The negative histogram indicates the presence of downward momentum, while the MACD lines have moved downwards from their recent increase in late August.
CLARITY Act Failure Adds Regulatory Uncertainty
The falling price of Bitcoin should also be considered against the backdrop of the CLARITY Act.
The law is meant to develop an overall framework for digital assets at the federal level. It would define the roles and responsibilities of the Securities and Exchange Commission and Commodity Futures Trading Commission. On September 15, the bill did not get the necessary 60 votes in the Senate.
The bill went through several versions before voting took place. A final version of the bill was published by Senator Cynthia Lummis and other Republican Senators, which incorporated 126 changes to the bill, including ethical standards, decentralized finance, and expanded powers to the state attorneys general.

What Bitcoin Holders Should Watch Next
The $76,000 zone continues to be a significant short-term level. The recovery above this zone might play a stabilizing role for the market following the drop seen recently.
Below this level, the $71,000 zone becomes more significant as it corresponds to the broader support zone identified by Alpha Crypto Signal and other technical studies. Further breakdown may lead to the $66,000 scenario coming into view, but according to Alpha Crypto Signal, that scenario is less probable.
On the positive side, Bitcoin price would have to start from the area of $78,000 and then move on to the $80,000 – $81,500 range. Prior technical analysis indicated that the $79,500 – $80,000 range is significant for recovery and can be used to undermine the bearish set-up if recovered.
The next major events to watch out for will be the Fed policy meeting and how Bitcoin reacts to the failure of the CLARITY Act vote.
Also Read | Injective Seoul Brings Tokenization and Stablecoins to KBW2026
This article contains market analysis and price predictions. These are not guarantees. Crypto markets are volatile. Always DYOR. Not financial advice.