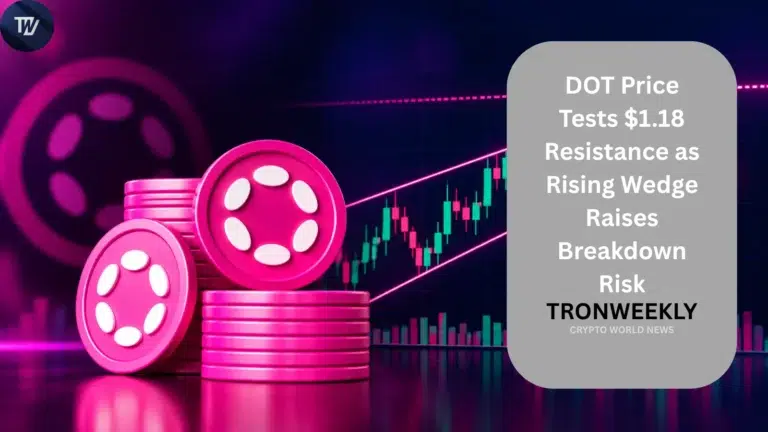
DOT price is showing mixed signals amid the approach to an important resistance level as well as the formation of a short-term rising wedge pattern indicating potential for a reversal.
Table of Contents
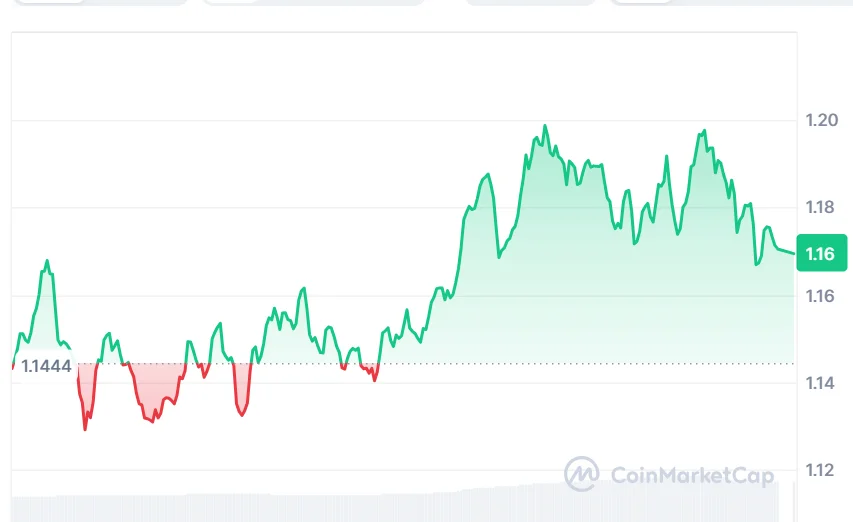
At the time of writing, DOT is trading at $1.16, with a 24-hour trading volume of approximately $306.73 million and a market capitalization of about $1.99 billion. The token has gained 2.32% over the last 24 hours.
DOT Price Faces Rising Wedge Resistance
A popular crypto analyst, Crypto With Gopal, noted on September 21 the presence of a rising wedge formation on the DOT’s 15-minute time frame. This technical setup has left DOT price near the top of the structure, trading around $1.18, making the coming price action crucial to its short-term trajectory.
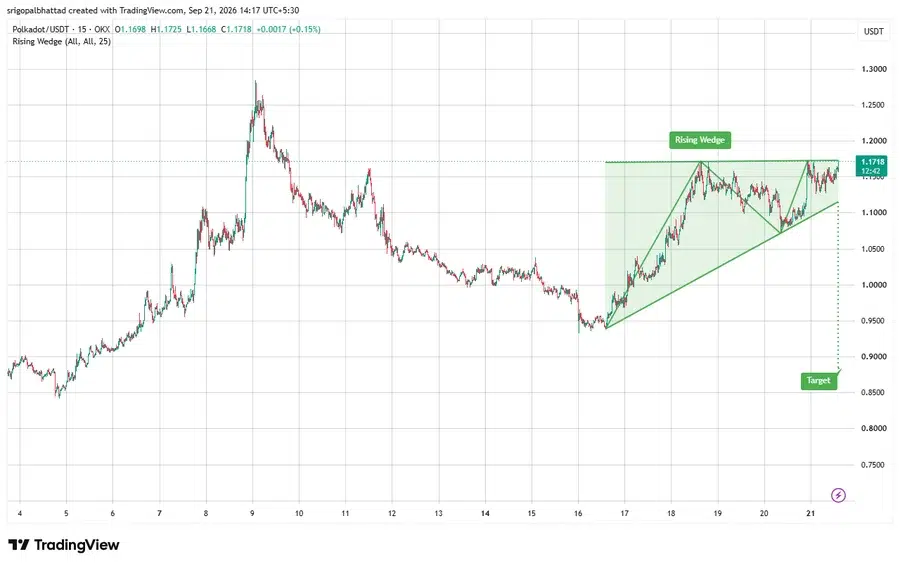
A reversal here could see DOT price drop to the levels of support seen below, targeting approximately $0.86. However, a breakout above the wedge will reduce or negate this bearish scenario.
The near-term support region is found in the range of $1.10-$1.12, whereas the current resistance level can be seen in the region of $1.17-$1.18. DOT finds itself in a situation where a clear direction of technical movement needs to be taken.
Also Read | SoftBank Junk Bonds Rise as Company Plans $11 Billion OpenAI Funding
Technical Indicators Show Mixed Signals
Additionally, DOT has traded above multiple crucial exponential moving averages. It is currently trading above the 20-day EMA at $1.03835, the 50-day EMA at $0.95956, and the 100-day EMA at $0.96800.
Nonetheless, DOT is below the 200-day EMA at $1.19029. The said level is extremely significant as it occurs right above the rising wedge resistance level. Any breach above the $1.19 level would bring positive changes to the technical setup, while any failure to break above would maintain the resistance pressure intact.
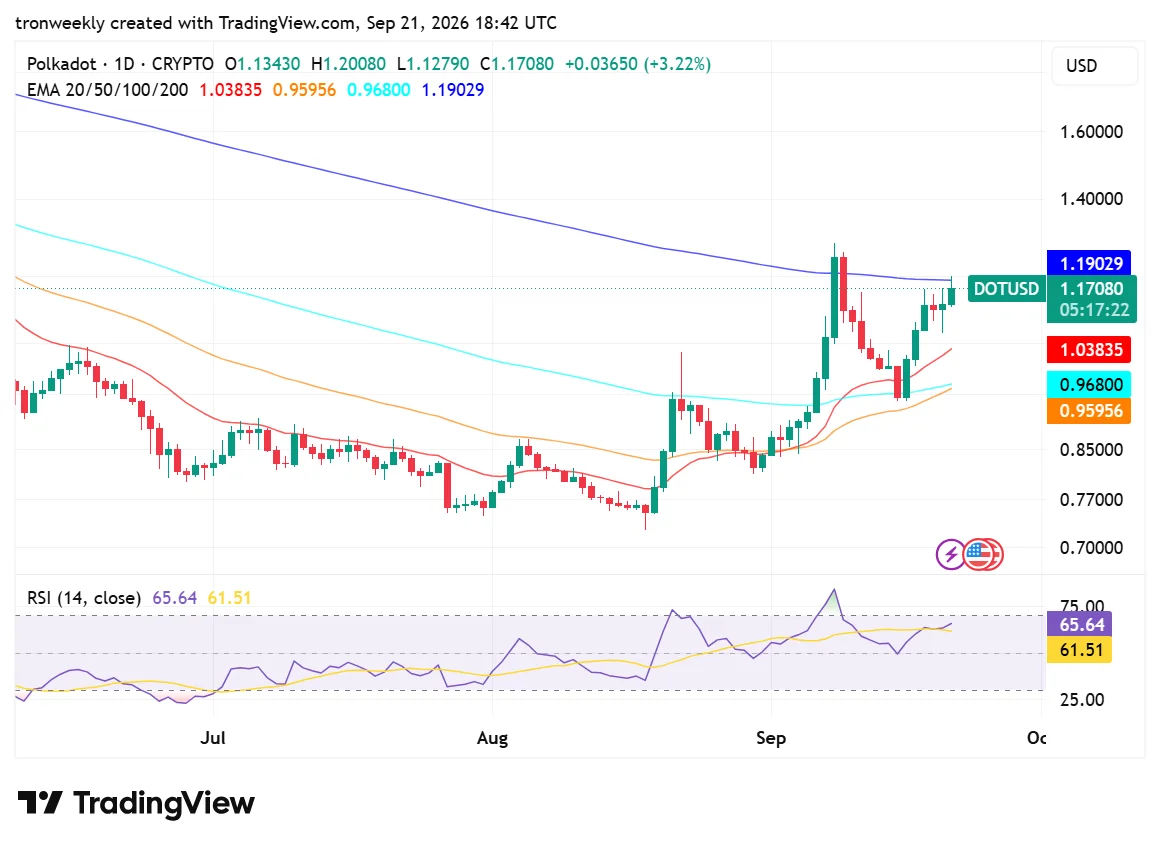
The momentum indicators are also giving a bullish bias. The RSI for DOT is currently at 65.64 and is trading above its average RSI level of 61.51. While the RSI is near the popular 70 region, it has not reached there yet.
An increase in the RSI means that the buying momentum is still intact. On the other hand, a fall below the average RSI level shows that the momentum is starting to weaken.
21Shares ETF Adds Institutional Access
Apart from the listed ETFs, there’s another stage that DOT has reached in accessing the markets through exchange-traded products.
The 21Shares Polkadot Staking ETF is quoted on Nasdaq and allows investors to gain exposure to the DOT asset without handling a wallet or buying the asset. The ETF holds some of its DOT assets and may distribute staking rewards to its holders.
The ETF’s presence on Nasdaq provides traditional investors with yet another alternative to get involved in Polkadot. This is crucial since the financial instrument can serve as a means of connecting DOT with those investors who may not be willing to trade via crypto exchanges.
According to market data, the moves in DOT’s price took place at the same time as attention on the ETF grew. DOT demonstrated a sharp spike after the ETF launch; however, further results were impacted by market conditions and ETF flow uncertainty.
What Happens Next for DOT Price?
The near-term emphasis is on the resistance area of $1.17-$1.18 and the 200-day EMA at $1.19. A move above these areas will be negative for the wedge pattern and could redirect attention to higher levels.
A move back to the area of $1.10-$1.12 after a failed attempt to break above resistance will reinforce the near-term bearish bias in the wedge pattern, with lower support areas being seen subsequently, including the bearish target level seen by Crypto With Gopal.
DOT’s structure, for the time being, has short-term momentum improvement coupled with substantial overhead resistance. The ETF has been able to add a crucial element of institutional accessibility; however, it remains to be seen if the demand created will be sustainable in nature.
Also Read | New Zealand-India Trade Deal Passes Parliament, Opens $20 Billion Investment
This article contains market analysis and price predictions. These are not guarantees. Crypto markets are volatile. Always DYOR. Not financial advice.