Ethereum price is lingering close to $2,700 while traders monitor whether this latest consolidation can turn into yet another breakout attempt.
Table of Contents
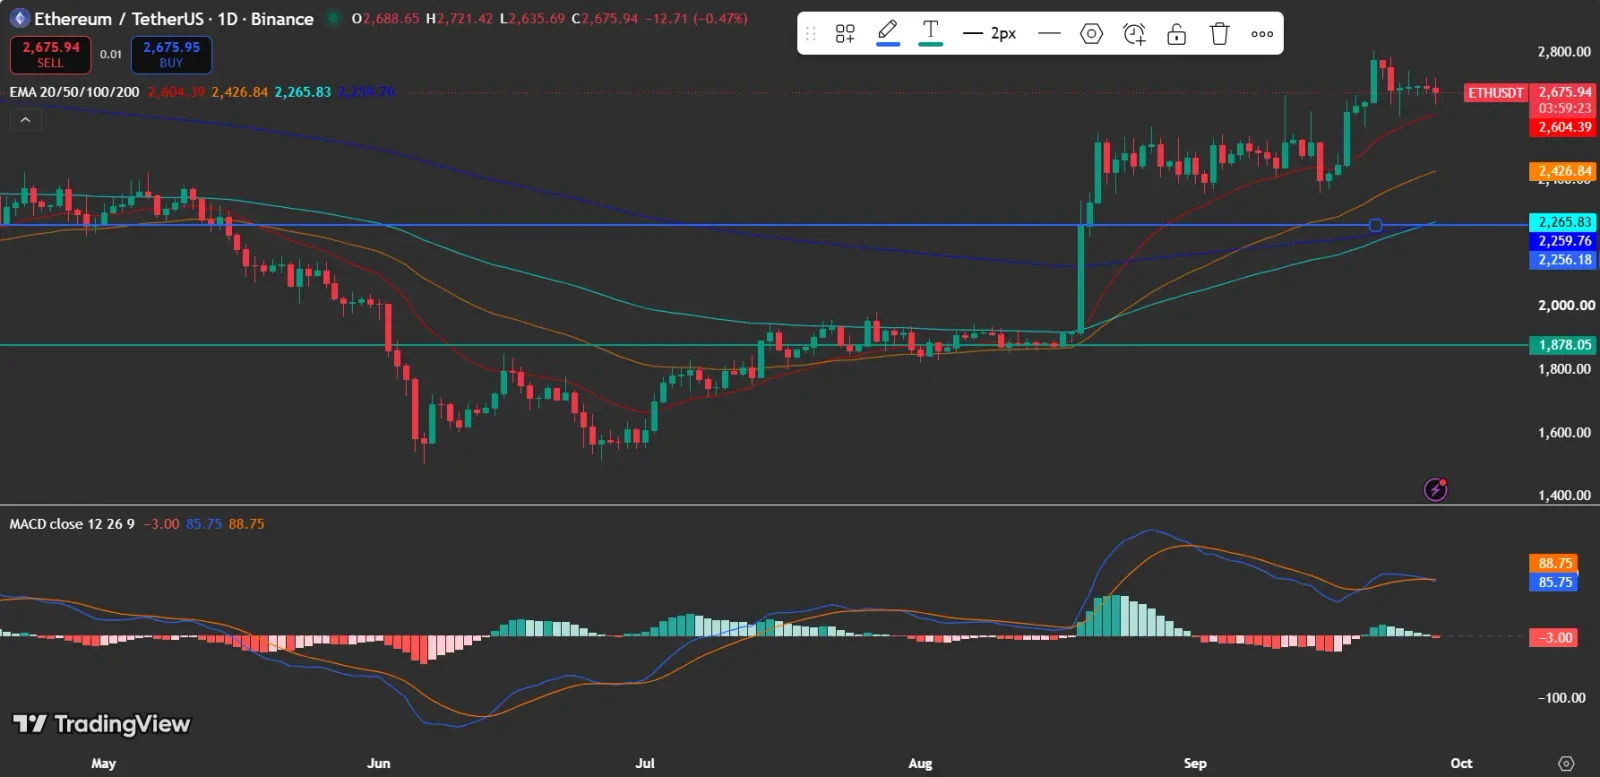
As of press time, Ethereum trades at $2,675.94, down 0.47% over the last 24 hours. The price continues to sit above its key exponential moving averages, while ETF inflows and heightened derivatives activity give further context to the present market picture.
Also Read: Ethereum Whales Show Strong Activity as ETH Price Eyes Further Upside
Ethereum Price Remains Above Crucial Moving Averages
On the daily TradingView chart, ETH is trading above its 20-day EMA of $2,604.39, with the 50-day, 100-day and 200-day EMAs positioned at $2,426.84, $2,265.83 and $2,259.76, respectively.
Despite the recent pullback, this setup keeps the broader trend intact. ETH recently climbed toward the $2,800 zone before easing back below it, which makes $2,700 a key level for the next move.
What Is the Ethereum Price MACD Indicating?
The MACD has softened a little, with the histogram at -3.00, while the MACD line at 85.75 stays beneath the signal line at 88.75. This points to short-term momentum having cooled off following the recent rally.
The signal has not yet changed the broader price structure, but it indicates that buyers must recover momentum for ETH to break through nearby resistance.
Also Read: Ethereum Roadmap 2030: Vitalik Buterin Maps Post-Hegota Overhaul
Can Ethereum Price Push Past $2,700?
An X post from Ali Charts points to $2,640 as a key support level and flags $2,700 as the next level to keep an eye on. According to the post, an hourly close above $2,700 could pave the way toward $3,000.
Ali Charts wrote, “$ETH appears to be forming a bull flag on the lower timeframes.” The post also said, “As long as $2,640 continues to act as support, the setup favors the bulls.”
That outlook matches the daily chart, where ETH is holding above its 20-day EMA. A sustained push above $2,700 would offer stronger confirmation, whereas a drop below $2,640 would undermine the setup.
Also Read: Ethereum Price Eyes $6,500 as Whale Activity Signals Renewed Interest
How Are Derivatives Supporting the Ethereum Price Setup?
CoinGlass data indicates Ethereum open interest has stayed elevated, hitting roughly $30 billion-$35 billion in recent sessions, with a larger spike around September 22. Trading volume has likewise stayed active, with recent daily figures often landing between $40 billion and $80 billion.
The elevated derivatives activity points to considerable market engagement, yet on its own the data cannot confirm whether traders are mostly betting on gains or losses.
What Do Ethereum ETF Inflows Reveal?
Data on spot Ethereum ETFs indicates that net inflows have persisted across recent trading sessions. The most recent number displayed is $86.95 million for September 25, coming after $66.01 million on September 24 and $104.63 million on September 23.
The largest inflow in recent days came on September 21 at $269.98 million, bringing cumulative total net inflows to $13.94 billion.
What Does the Ethereum Price Setup Suggest Next?
Ethereum’s technical setup continues to find support from its moving averages, yet the negative MACD histogram points to weakening short-term momentum. As a result, the $2,640-$2,700 zone stays key for the next directional shift.
ETF inflows add further market context, while high open interest and trading volume demonstrate that derivatives activity remains elevated. Whether this setup leads to another rally hinges on how ETH behaves around the levels close by.
Crypto markets stay extremely volatile, so traders ought to watch price movement, market sentiment, and upcoming catalysts prior to making any investment choices.
Also Read: Ethereum Adoption: Massive Boom in ETH Bank Takeover
This article contains market analysis and price predictions. These are not guarantees. Crypto markets are volatile. Always DYOR. Not financial advice.