XRP price is facing resistance despite Ripple’s reported involvement in the DTCC’s tokenization initiative, while fading technical momentum suggests the token needs to overcome key levels before a sustained recovery can take hold. As of press time, XRP is changing hands at $1.3040, a 0.24% decline over the last 24 hours.
Table of Contents
Ripple Prime’s reported role in the DTCC’s tokenization initiative gives the market outlook an institutional dimension, although the announcement does not confirm that XRP itself will be used directly in the initiative.
Also Read: XRP Exchange Reserves Hit Yearly High as Binance Open Interest Falls 15.8%
Why Is the XRP Price Under Pressure Even After Latest Development?
In an X post, Amonyx drew attention to the development, noting that Ripple Prime is joining the DTCC’s tokenization initiative, which is slated to launch this month and involves $114 trillion in assets under custody, according to the post.
The move brings Ripple’s institutional footprint into focus as financial markets increasingly examine tokenization. Even so, the reported asset figure reflects the size of assets under custody, not the amount confirmed to be undergoing tokenization or flowing into XRP.
Amonyx highlighted the scale of the development with the phrase “HUGE FOR $XRP!” Yet the announcement’s significance for XRP’s market price will depend on whether the initiative eventually creates a direct use case for the token or influences investor sentiment more broadly.
Also Read: Bitwise XRP ETF Reaches $561 Million as Fund Leads Issuers
What Does the TradingView Chart Reveal About the XRP Price?
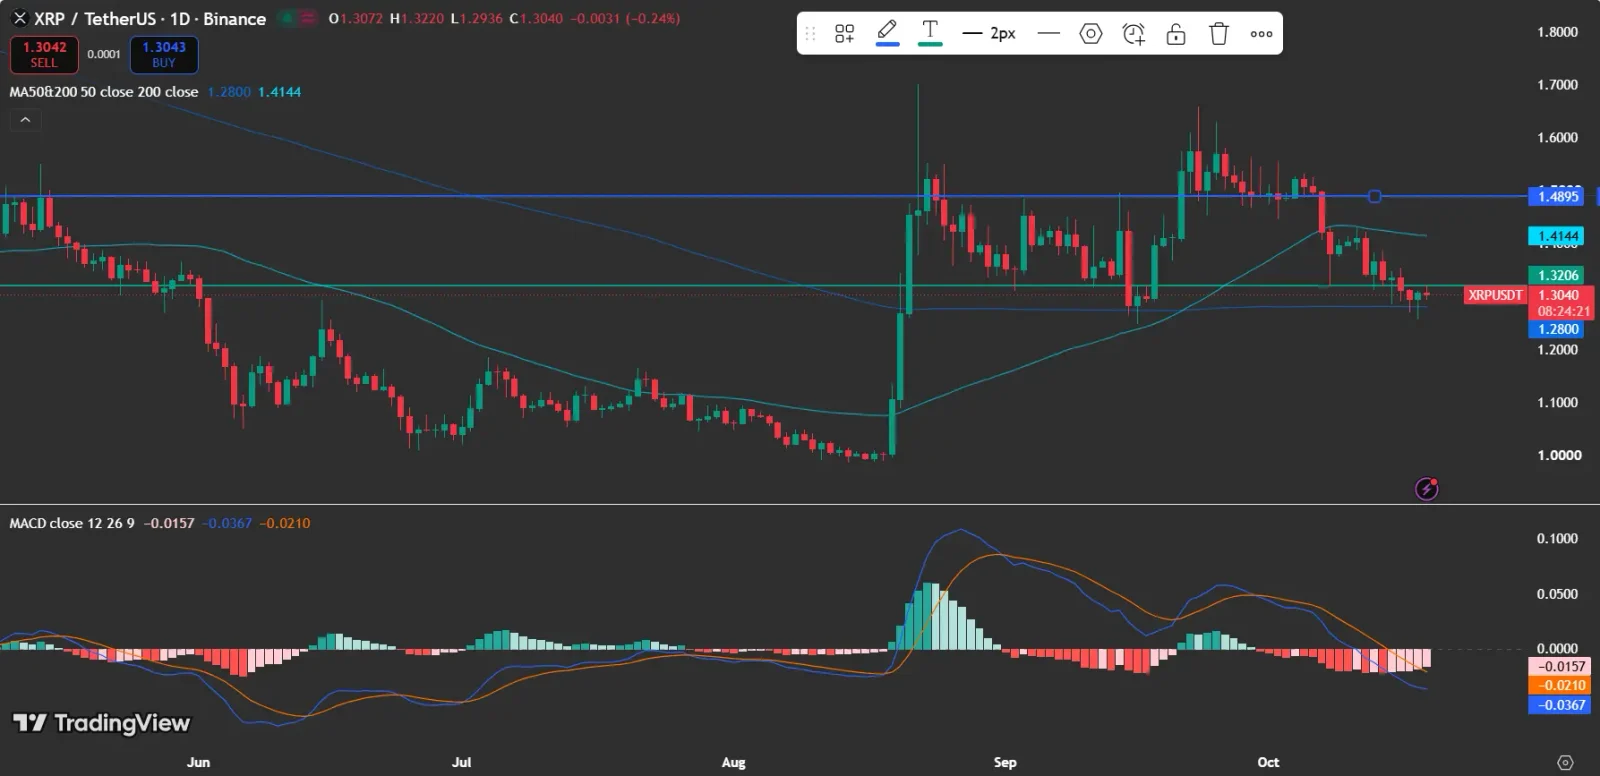
On its daily chart, XRP is pulling back following its September rally. The price has dropped below its 50-day moving average of $1.4144 and is trading near its 200-day moving average of $1.2800.
The $1.2800 level is a key zone to monitor, since a sustained hold there could help XRP find stability. A break beneath it would further weaken the chart, whereas a rebound above the 50-day moving average would offer an early signal that momentum is improving.
Can the XRP Price Break Through $1.49 Resistance?
According to the chart, $1.4895 stands out as a major resistance level. Before a stronger push toward this resistance can be considered convincing, XRP would first need to climb back above the $1.4144 moving average.
A breakout past $1.4895 could brighten the technical picture. Until that happens, the token remains exposed to further consolidation, with the $1.2800 moving average serving as an important downside level to watch.
Also Read: XRP Ledger Tokenization Reaches Billions in Real-World Assets
How Does CoinGlass Data Shape the XRP Price Outlook?
CoinGlass data indicates that open interest has declined from its late-September highs alongside XRP’s price during October. This suggests that the value of outstanding futures positions has decreased, although the chart alone cannot establish whether traders are predominantly bullish or bearish.
The volume chart also shows that trading activity has eased from some of its September peaks, although several individual spikes remain visible.
This suggests that the recent price decline has occurred without a sustained return to the highest activity levels seen during the period. Traders may need further confirmation from price action and derivatives data before determining whether selling pressure is weakening.
What Can XRP ETF Flows Tell Us About Market Sentiment?
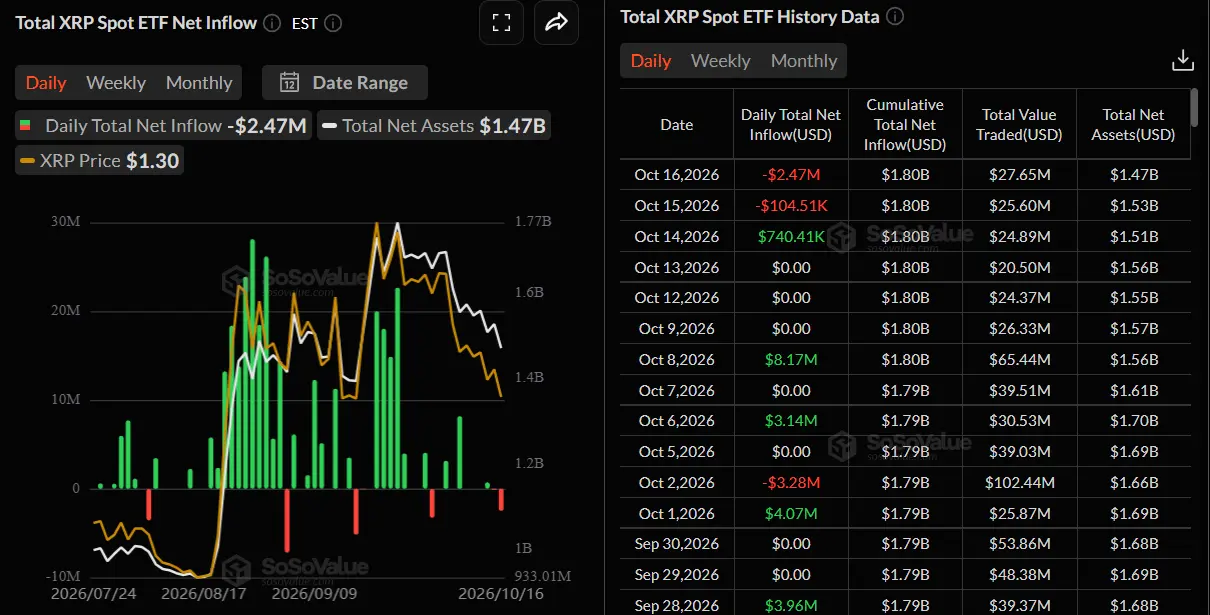
According to SoSoValue data, XRP spot ETFs posted a net outflow of $2.47 million on October 16, 2026. Total net assets stood at $1.47 billion, while cumulative net inflows remained at $1.80 billion.
The daily outflow suggests a degree of near-term selling pressure, even though cumulative inflows remain positive.
These figures offer a mixed picture: the daily flow was negative, but the cumulative net inflow indicates that aggregate flows over the tracked period remained positive. The figures are specific to October 16 and do not establish the direction of subsequent ETF flows.
Also Read: XRP Ledger Security Fix Addresses Critical Supply Vulnerability
What Should Traders Keep an Eye On Next for the XRP Price?
XRP’s near-term technical outlook hinges on whether buyers can hold $1.2800 and push back above $1.4144. The MACD remains bearish, with the MACD line at -0.0367 below the signal line at -0.0210, while the histogram stands at -0.0157.
The negative MACD readings indicate that bearish momentum remains in place, although they do not guarantee further losses. A rebound above the 50-day moving average could reinforce the bullish case and put $1.4895 in focus.
By contrast, a sustained break below the 200-day moving average would weaken the technical outlook and raise the risk of further downside.
Ripple Prime’s reported involvement in the tokenization initiative gives the market an institutional narrative, though its effect on XRP demand remains unclear.
For now, the chart shows a token trading below its 50-day moving average, with the 200-day moving average providing a key level to monitor. Cryptocurrency markets remain highly volatile, and traders should monitor price action, market sentiment, and upcoming catalysts before making investment decisions.
Also Read: XRP Treasury Evernorth Completes SPAC Merger With 473M XRP
This article contains market analysis and price predictions. These are not guarantees. Crypto markets are volatile. Always DYOR. Not financial advice.