• Skip to primary navigation
  • Skip to main content
  • Skip to primary sidebar
  • Skip to footer
  • About TronWeekly
  • Write for us
  • Terms and Conditions
  • Privacy Policy
  • Disclaimer
  • Contact
  • All Posts
  • Advertise

TronWeekly

Crypto World News

  • Home
  • Latest News
  • Opinion
    • Education
    • Best TRON Wallets
    • Beginner’s guide to TRON
    • Tron Tokens
    • Market Analysis
  • Industry
    • Tron Exchange
    • Project Review
  • Press Release
  • Bitcoin (BTC)
  • Ripple (XRP)
  • Advertise
  • About TronWeekly
    • The Team
    • Editorial Policy
    • Write for us
    • Privacy Policy
    • Disclaimer
    • Terms and Conditions
    • Contact
You are here: Home / All Posts

All Posts

TRX Price Surges as Institutional Buying Grows: Is $0.47 the Next Target?

By Usman Zafar | Edited By Ammar Raza,May 17, 2026, 11:46 PM

TRON (TRX) is testing a major resistance zone as bullish momentum strengthens. Technical indicators and rising buying pressure suggest potential upside for the TRX price if the breakout holds. Meanwhile, Tron Inc.’s latest TRX purchase reflects growing institutional confidence in the TRON ecosystem.

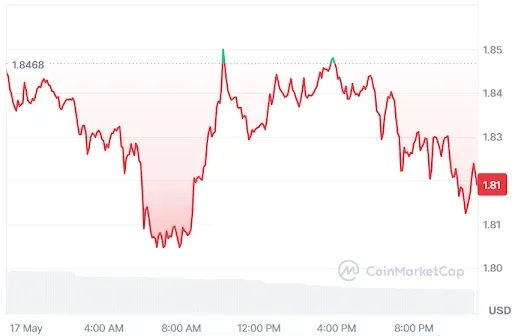
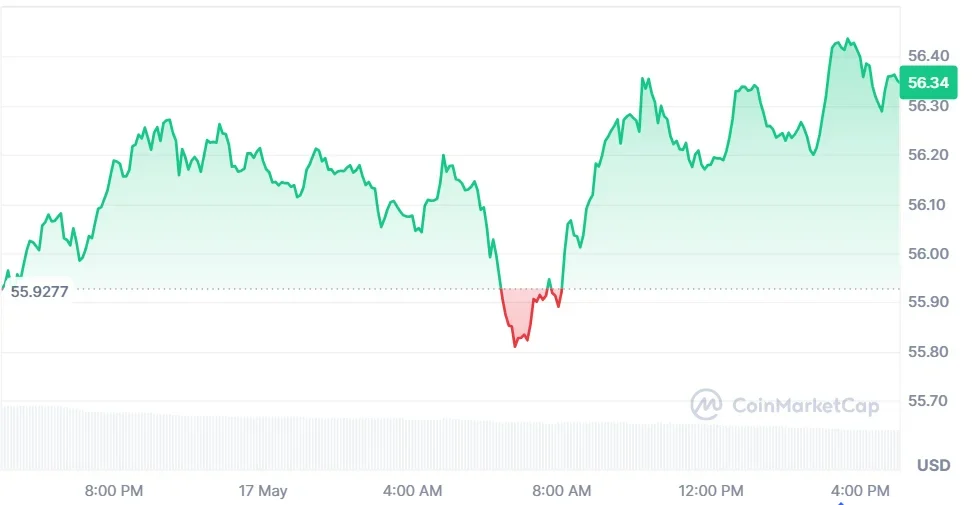
At the time of writing, TRX is trading at $0.3569 with a 24-hour trading volume of $610.1 million and a market capitalization of $33.83 billion. After the 1.39% surge over the last 24 hours, now everyone’s focus is on whether the previous resistance caps the upward momentum again or paves the way for a strong uptrend.

TRX Price chart

Source: CoinMarketCap

TRX Price Could Rally to $0.47 if Breakout Holds

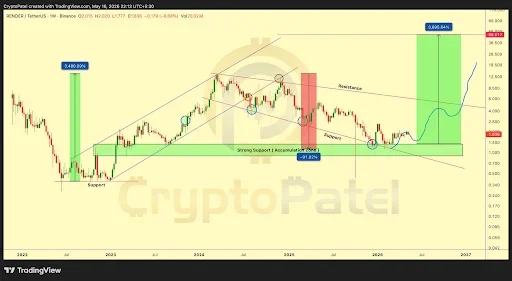
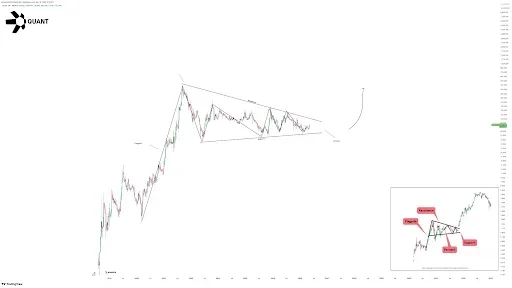
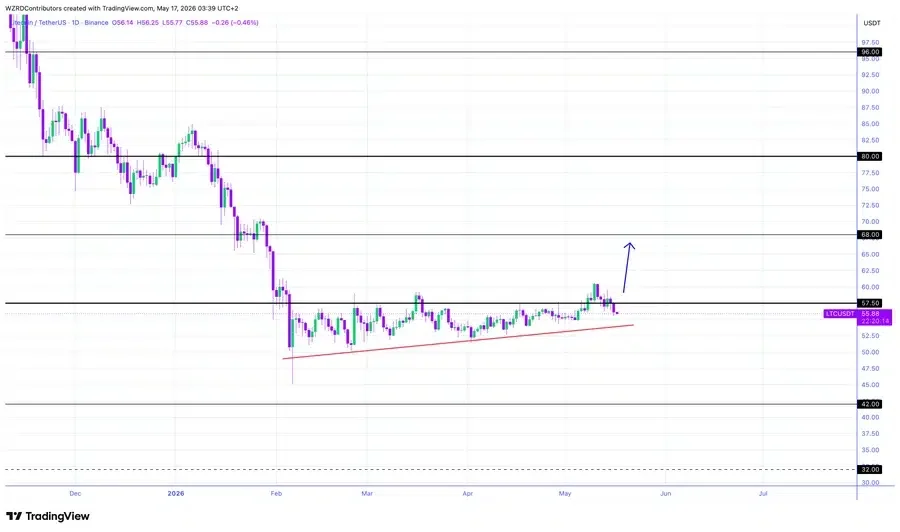
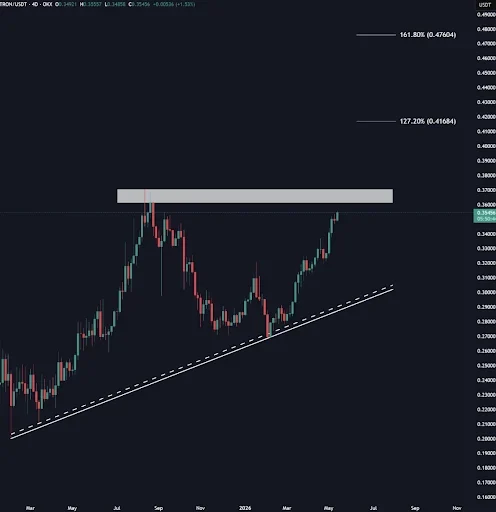
According to the crypto analyst Chiefrat, the TRX price is once again testing the crucial $0.36–$0.37 resistance zone, the same area that rejected its previous major rally. 

After months of gradual upside movement, bulls continue building momentum as buying pressure strengthens. Traders are now watching closely for a decisive breakout that could confirm renewed market confidence in TRX price breakout.

TRX price analysis

Source: Chiefrat’s X Post

If the TRX price succeeds in breaking through the resistance level, it will have its next potential gain towards $0.416, as expected by analysts. If the upward movement persists, the $0.476 level would be the subsequent target. 

However, the current level acts as the battleground between bulls and bears. The question is whether bulls will be able to overcome bears.

Also Read: TRON (TRX) Builds Strength Above $0.32 as Bulls Stay Active

Technical Indicators Support Bullish Reversal

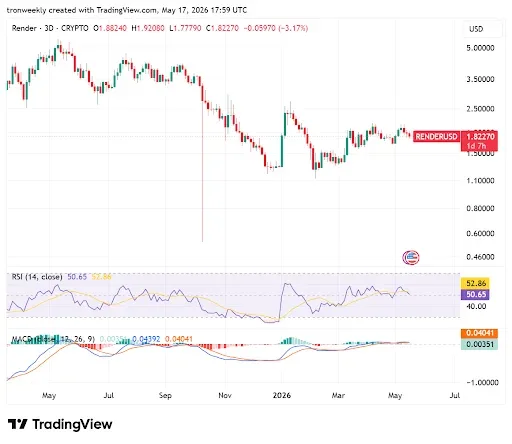
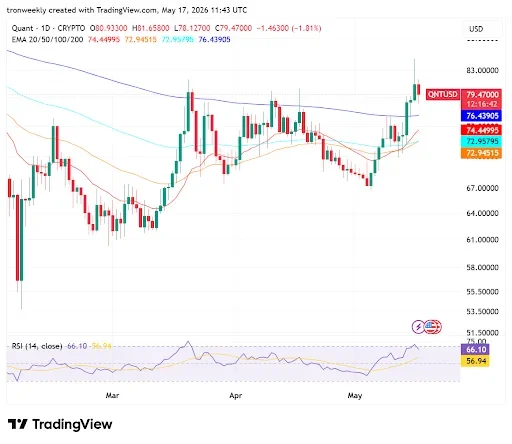
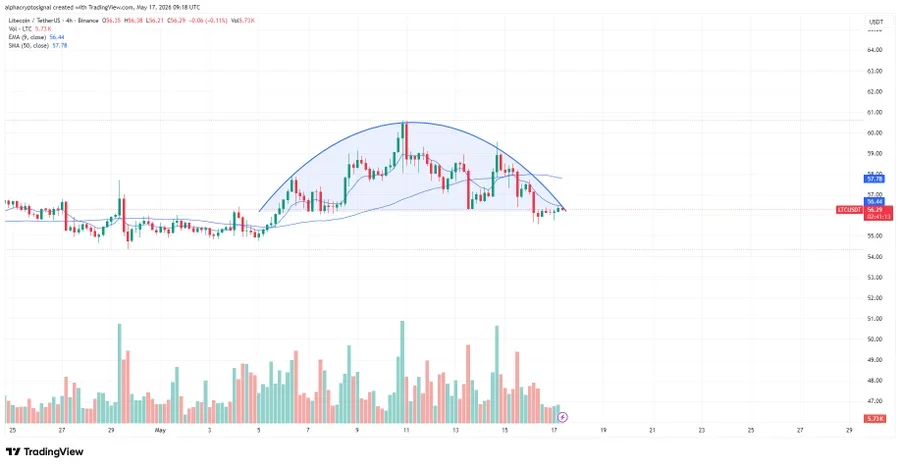
According to TradingView, the upward momentum of the TRX price is still going strong. After a retracement that held ground around the level of $0.28000 just above the 100-day EMA, an evident trend reversal occurred during the early part of 2026. At present, the TRX price is standing at $0.35681 while attempting to reach the previous peak.

TRX technical indicators

Source: TradingView

As the prices keep rising, the relative strength index (RSI) reflects this and shows the presence of aggressive buying. The RSI falls into the state of overbuying with the value of 78.16, which is far above the level of the yellow alert line. 

This indicates the presence of an extremely powerful bullish potential for the TRX price that may soon correct itself with a pullback to the 20 EMA of $0.33055.

Tron Inc. Expands TRX Treasury With New Purchase

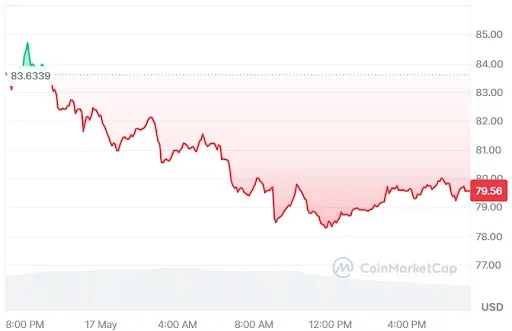
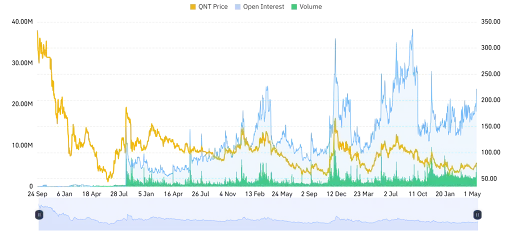
The data from Tron Inc. further highlighted that the firm further enhanced its crypto treasuries strategy with yet another investment in the form of 141,873 TRX tokens, which cost them an average of $0.3524 per token. 

This latest investment brought their TRX token holdings past the 696.4 million mark. Their conviction in the future success of the TRON network is evident here.

Tron Inc. Expands TRX Treasury With New Purchase

Source: TRONSCAN

This is in view of the fact that building up the treasuries of the Tron digital asset continues to be one of the focal points in the company’s strategy for increasing its shareholder value in the coming years. 

The consistent build-up of the TRX can be seen as an indication of the rising interest of institutions in alternate digital assets through public companies.

This article contains market analysis and price predictions. These are not guarantees. Crypto markets are volatile. Always DYOR. Not financial advice.

Also Read: TRX Price Prediction: Bullish Breakout Signals Potential Rally Toward $0.38

Filed Under: Cryptocurrency News

RENDER Price Prediction: Strong Fundamentals Could Fuel Long-Term Move to $50

By Usman Zafar | Edited By Ammar Raza,May 17, 2026, 11:37 PM

RENDER price is showing upside potential as fundamentals are improving, AI-driven GPU demand rises, and token burns reduce supply. Network capacity is expanding, yet RSI and MACD show neutral consolidation. Long-term outlook depends on continued AI adoption, with strong potential upside.

At the time of writing, RENDER price is trading at $1.82 with a 24-hour trading volume of $26.87 million and a market capitalization of $944.23 million. Despite the neutral price outlook, participants are eager to see whether RENDER’s growing fundamentals could push the price to new highs ahead.

RENDER Price

Source: CoinMarketCap

Also Read: RENDER Price Could Surge to $12 Following Descending Channel Breakout

RENDER Price Could Surge to $50 Amid Strong Fundamentals

Furthermore, the crypto analyst Crypto Patel revealed that RENDER price remains down more than 86% from its all-time high despite fundamentals strengthening across its decentralized GPU network. 

Over 71 million frames have been rendered, while AI workloads now account for 35–40% of total usage. This divergence between price and adoption highlights growing infrastructure demand across AI compute markets globally in the current cycle.

The core fundamentals continue to become increasingly stronger thanks to the burn-and-mint mechanism through Render: each GPU task burns the RENDER tokens, increasing the pressure on supply. 

According to reports, token burns increased by 278%, while integration with the Salad Network added about 60,000 GPUs. Enterprise hardware NVIDIA H200 and AMD MI300X increase capacity and prepare the way for massive adoption of AI computing needs.

RENDER Price chart

Source: Crypto Patel’s X Post

The narrative of RENDER is based on two cogs. At the RenderCon 2026 event, players associated with NVIDIA, Stability AI, and WME took to the stage while global spending on AI is headed toward hitting the $2 trillion target. 

According to reports, Grayscale has approximately 22% exposure among crypto investments focused on AI. While the bulls see a broad runway for gains between $10 and $25, optimistic projections are closer to the $50 level.

Momentum Indicators Point to a Neutral Outlook

According to TradingView, the RSI is steadily holding at 50.65, just below the yellow warning line of 52.86. 

Following a bounce after falling into an extreme oversold condition towards the end of last year and reaching a peak level in the early part of 2026, the RSI has since stabilized. Here, buying and selling momentum are perfectly balanced.

RENDER Momentum Indicators Point to a Neutral Outlook

Source: TradingView

The MACD indicator supports the impression of a quiet and low-volatility consolidation. The blue MACD line at 0.04392 remains very close to the orange signal line at 0.04041, generating a histogram very close to the horizontal level at 0.00351. 

The squeeze suggests that while bearish momentum is now gone, bullish momentum still needs to develop.

This article contains market analysis and price predictions. These are not guarantees. Crypto markets are volatile. Always DYOR. Not financial advice.

Also Read: RENDER Price Prediction: Breakout Above $2.05 Could Trigger Strong Rally

Filed Under: Cryptocurrency News, Altcoin News

QNT Price Breakout Targets $360 Rally After Reclaiming Key Moving Averages

By Sadia Ali | Edited By Ammar Raza,May 17, 2026, 11:00 PM

Quant (QNT) shows bullish momentum after breaking above key moving averages, while the RSI signals continued buying strength for the QNT price. However, declining open interest and trading volume reflect cautious sentiment and weaker participation in the derivatives market despite improving price structure.

At the time of writing, QNT is trading at $79.56 with a 24-hour trading volume of $19.09 million and a market capitalization of $940.2 million. Despite the 7.21% decline over the last 24 hours, participants are waiting to see if the QNT price could pass the key resistance to trigger a reversal.

QNT price

Source: CoinMarketCap

Quant Price Outlook Turns Bullish After Support Rebound

According to the crypto analyst Jonathan Carter, QNT appears to be gaining traction amid its resurgence from an important level of support, signaling the potential emergence of a new uptrend. 

Technical analysts suggest that the asset is now on the verge of a vital breakout phase, supported by buyers’ unwavering resistance against lower highs. Increased optimism has led to hopes that QNT might soon begin an impressive rise.

Quant Price Outlook Turns Bullish After Support Rebound

Source: Javon Marks’ X Post

Assuming that there is a breakout, the QNT price is seen to be moving towards the price level of $360, implying around 328% growth from its present price point. 

This amounts to an almost 4.28x profit in terms of percentage. This will translate into gains of more than four times, which would make QNT one of the best altcoin performers.

Also Read: Quant (QNT) Stabilizes at $70 Before Possible $260 Expansion Wave

QNT Price Eyes Breakout Above Key Moving Averages

According to TradingView, the QNT price has finally broken higher following a long-term consolidation trend. 

It surpassed its 20, 50, and 100 EMAs and peaked around the $84 mark before encountering rejection from the 200 EMA level. At present, the QNT price is retracing back down to $79.47, testing the strength of the new upturn.

QNT Price Eyes Breakout Above Key Moving Averages

Source: TradingView

The RSI indicator supports this current rally, where the purple curve climbs way above the yellow signal line and touches 66.10. 

On the verge of entering the overbought territory, it indicates that the strong buying trend has potential for further expansion. The current stabilization follows suit with the QNT price action, implying a possible consolidation phase before deciding on the future direction.

Derivative Data Points to a Cautious Outlook

Despite this constructive price structure, derivative data point to a cautious outlook. According to Coinglass, the QNT open interest has dropped by 4.10%, to reach $22.07 million. The decline implies that the current open interest is being reduced by market players, not increasing it, thus implying weak investor participation.

Derivative Data Points to a Cautious Outlook

Source: Coinglass

The trading volume declined by 10.05% to $52.34 million. This decline reflects lower demand and supply in the market and suggests that there might be weaker momentum or lower liquidity in the market.

This article contains market analysis and price predictions. These are not guarantees. Crypto markets are volatile. Always DYOR. Not financial advice.

Also Read: QNT Price Shows 60% Upside Potential as Bulls Challenge Resistance Trendline

Filed Under: Cryptocurrency News

IOTA Price Analysis: Bullish FVG Retest Signals Breakout Toward $0.0671

By Sadia Ali | Edited By Ammar Raza,May 17, 2026, 10:38 PM

IOTA shows a bullish fair value gap retest after a market structure shift, suggesting potential continuation if support holds. However, recent rejection and bearish momentum indicate short-term weakness for the IOTA price. Upside depends on confirmation, with invalidation below key support.

At the time of writing, IOTA is trading at $0.05597 with a 24-hour trading volume of $9.71 million and a market capitalization of $248.75 million. Following the signs of stability over the last 24 hours, the traders are eager to see if the fear value gap retest could trigger a bullish wave or push the price deeper.

IOTA price chart

Source: CoinmarketCap

Also Read: IOTA Price Analysis: RSI at 38.31 Signals Recovery Toward $0.06 Targets

IOTA FVG Retest Points to a Breakout toward $0.0671

The crypto analyst Crypto Patel revealed that IOTA is showing a technically significant setup as the price retraces into a bullish fair value gap following a confirmed market structure shift. The higher timeframe structure remains intact, suggesting continuation potential despite the short-term pullback. 

Liquidity has been swept internally, indicating possible preparation for expansion toward higher resistance zones above for the IOTA price in the coming sessions.

The IOTA price is retracing towards the bullish fair value gap, which is an area viewed by traders as a potential demand level, which means that the bulls could come back into play if the structure holds up. 

The presence of liquidity above suggests that the price may be heading to the next level. However, the bias remains bullish but awaits confirmation on the lower time frame structure to go for the upside targets.

IOTA FVG Retest Points to a Breakout toward $0.0671

Source: Crypto Patel’s X Post

In case of the emergence of a positive reaction from the FVG area in the asset, the IOTA price may make a move towards key liquidity areas such as 0.0610, 0.0650, and 0.0671. 

However, in case of closing below 0.0540 during the trading day, the trade setup will become void and the bullish structure lost. Overall, the scenario can be described as a continuation setup.

IOTA Price Faces Short-Term Bearish Pressure

Despite the bullish price setup, the IOTA price encountered a quick reversal after a brief rally witnessed in mid-May. 

According to TradingView, the IOTA price slid downwards from March, stabilizing at around $0.0540 in April before rising sharply to $0.0660. However, a wave of sell-offs forced a quick retracement back to $0.05604, below its 20-day SMA.

IOTA Price Faces Short-Term Bearish Pressure

Source: TradingView

Technical indicators show a sharp fall in bullish momentum. The Bollinger Bands have expanded massively amid increased volatility, but the price action is moving towards the lower boundary. 

Moreover, the MACD lines are turning down to form a bearish cross, while the histogram turns red to reflect that buying interest is now almost non-existent.

This article contains market analysis and price predictions. These are not guarantees. Crypto markets are volatile. Always DYOR. Not financial advice.

Also Read: IOTA Price Stabilizes at $0.057: Is a Major Rally to $0.25 Coming Next?

Filed Under: Cryptocurrency News, Altcoin News

SUI Price Prediction: Support Retest Could Determine Next Move to $1.40

By Sadia Ali | Edited By Ammar Raza,May 17, 2026, 10:21 PM

SUI price is pulling back after a strong rally, testing key support while the uptrend remains intact. RSI cooled to neutral, and MACD turned bearish, showing short-term weakness. Additionally, lower volume and open interest also indicate reduced participation and a likely consolidation phase.

At the time of writing, SUI is trading at $1.06 with a 24-hour trading volume of $369.72 million and a market capitalization of $4.26 billion. Despite the expectations for a bullish reversal, the SUI price remained in a neutral phase over the last 24 hours.

SUI price chart

Source: CoinMarketCap

SUI Support Test Could Trigger Renewed Momentum

The crypto analyst BitGuru pointed out that SUI is pulling back after a strong bullish rally, easing into a key support zone as the market cools and traders take profits. 

The SUI price still maintains a broader uptrend structure, with buyers closely monitoring this area where demand previously stepped in and reversed selling pressure during earlier consolidation phases.

SUI Support Test Could Trigger Renewed Momentum

Source: TradingView

If this support level holds, momentum could quickly return, potentially driving a renewed upside move for the SUI price as buyers regain control. 

A successful defense may open the path toward the 1.20–1.40 range, where prior resistance sits. However, losing this zone could extend the correction, making it a critical decision point for near-term direction.

Also Read: SUI Price Breakout Holds: Bulls Eye $4.20 Target After Pullback Signal

Momentum Indicators Support Cautious Optimism

The momentum indicators also support this cautious price structure. According to TradingView, RSI (14) switches from a bullish phase to a bearish phase due to the recent downward spike in the SUI price. 

The purple RSI indicator has dropped from its overbought level of 80 to close at 51.54, below the yellow moving average of 62.98. This sharp fall may indicate that the bulls are losing steam.

SUI Momentum Indicators Support Cautious Optimism

Source: TradingView

Meanwhile, the MACD indicator cements the bearish turn by generating a fresh bearish crossover. The blue line moves below the orange line, while the bars on the histogram turn red and contract towards zero. 

Such an arrangement indicates that short-term sellers control market activity and prevent the SUI price from moving upwards.

SUI Derivative Data Point to Mixed Outlook

Furthermore, derivative data also support the consolidation phase; the SUI open interest fell by 0.35% to $685.19 million, implying that there is a slight reduction in the number of derivative instruments in place. Looking at the wider context of the recent trading trend, it means that traders are being conservative and reducing their position sizes.

SUI Derivative Data Point to Mixed Outlook

Source: Coinglass

The trading volume fell by 29.08% to close at $752.62 million. The fall indicates low liquidity and weak momentum in the market, suggesting that the traders are more careful in their investments due to the prevailing market situation in the short term.

This article contains market analysis and price predictions. These are not guarantees. Crypto markets are volatile. Always DYOR. Not financial advice.

Also Read: SUI Price Breaks Descending Channel as Momentum Builds Toward $4.20

Filed Under: Cryptocurrency News, Altcoin News

SUI Price Prediction: $1.44 Resistance Levels in Focus After Correction

By Tina Fatima | Edited By Ammar Raza,May 17, 2026, 9:01 PM

Sui price continued holding a key support zone despite recent weakness, keeping the broader bullish outlook active. Technical indicators showed slowing momentum after the rally, though buyers still maintain partial control. Meanwhile, optimism around the Clarity Act and institutional adoption strengthened overall sentiment surrounding the SUI ecosystem.

SUI Price Holds Critical Fibonacci Support Zone

According to the crypto analyst MCO Global, the SUI price is trading near a major Fibonacci retracement zone after facing rejection from its recent rally peak.

Price currently holds around the $1.02 support region, which remains critical for maintaining bullish momentum. Buyers defending this area could help stabilize sentiment and support another attempt at an upward continuation ahead.

The Elliott Wave structure on the chart suggests the recent decline may represent a corrective phase before another expansion move develops.

SUI price prediction chart
Source: @moretradingonl

If bullish momentum returns, resistance levels near $1.17 and $1.44 may become immediate upside targets. Stronger continuation could later expose the higher projected extension zones above.

On the downside, losing support around the current retracement cluster may trigger additional weakness toward lower Fibonacci levels near $0.97 and $0.85.

A deeper breakdown could invalidate the short-term bullish setup entirely. Overall, the broader structure still favors recovery while higher support levels remain protected by bulls.

Also Read: SUI Price Breaks Descending Channel as Momentum Builds Toward $4.20

Momentum Indicators Show Bullish Weakness Emerging

From an Indicators perspective, the RSI (14) is at approximately 51.75, with an RSI Moving Average of 62.99, suggesting that the upward momentum is weakening despite a prior overbought move.

While prices decline, RSI is above the critical level of 50, indicating that buyers have not fully lost control over SUI price action.

SUI tradingview chart
Source: TradingView

MACD Signal strength is waning since MACD lies very close to the level 0.05112, while signal lines are slightly lower at the 0.05374 level.

The histogram is in negative territory and at levels of -0.00262, suggesting that momentum is weakening somewhat. However, MACD is still positive, which means that the overall trend is bullish.

Clarity Act Boosts Institutional SUI Sentiment

SUI price sentiment received fresh support after the co-founder of Sui Network, Eman Abio, emphasized the role the Clarity Act could play in transforming crypto institutional adoption.

The new regulatory framework will bring about more clarity in the regulations, thus incentivizing large financial institutions to move operations on-chain, which is expected to bring more long-term investments to the SUI ecosystem.

This will enhance the optimism for the digital asset. Market adoption, trades, and sentiments can be boosted because of such trends. Now, traders are keenly waiting for confirmation on whether SUI can continue to hold above significant support lines.

This article contains market analysis and price predictions. These are not guarantees. Crypto markets are volatile. Always DYOR. Not financial advice.

Also Read: SUI Price Breakout Holds: Bulls Eye $4.20 Target After Pullback Signal

Filed Under: Altcoin News

Litecoin Price Forms Rounding Top: Will $56.25 Support Hold?

By Yahya Raza Sherazi | Edited By Messam Raza,May 17, 2026, 7:00 PM

Litecoin price remained under pressure on Sunday, May 17, as buyers failed to build stronger momentum. Analysts pointed to weakening short-term structure, lower market participation, and a possible breakdown setup if sellers gain control near the base zone.

As of writing, Litecoin (LTC) is trading at $56.34, marking an increase of 0.75% in a day. The trading volume is down by 38.86% and is currently standing at $189.68 million. Over the last week, the LTC coin price has declined by 3.48%, according to CoinMarketCap.

Source: CoinMarketCap

Also Read: Dogecoin Price Signals Major Breakout Potential as DOGE Targets $0.15

Litecoin Price Faces Breakdown Risk Near Neckline

Analyst Alpha Crypto Signal highlighted that LTC is forming a rounding top pattern after failing to stay above local highs. The analyst pointed out that the token is converging towards the support level, and the moving averages of the short time frame have less bullish control on the chart.

The same outlook placed focus on the base of the structure. A clean break below that neckline area, with volume confirmation, could activate the rounding top setup and allow further downside continuation if sellers take control near key support levels.

Source: X

Moreover, another analyst, CryptoWZRD, revealed that LTC is barely bearish on the daily chart, but the intraday chart remains in a range. The analyst noted that a break below $56.25 could signal weakness, but a move above could extend a range in the market for the time being.

Source: X

Futures Volume Falls as Open Interest Slips

According to CoinGlass data, the future volume dipped by 46.97% to $204.41 million, whereas open interest decreased by 0.90% to $354.77 million. The OI-weighted funding rate was 0.0019%, indicating low market confidence among leveraged traders.

Source: CoinGlass

Litecoin Price Stays Below Key EMA Levels

TradingView data shows that the Litecoin price is currently trading around $56.36 on the daily chart. The 20-day EMA was at $56.89, with the 50-day EMA at $56.38 and LTC just below both short-term EMAs and within a tight resistance zone.

Longer-term EMA levels were still above the prevailing prices. The 100-day EMA is at $58.82, while the 200-day EMA is at $67.05, indicating resistance in the price of Litecoin before the price can make a broader recovery on the daily time frame.

Source: TradingView

The Relative Strength Index (RSI) charts also showed a period of less momentum in the recent pullback. The 14-day RSI stood at 48.64, while the RSI moving average was 56.95, placing the indicator below its signal line and away from the upper zone in daily momentum data.

This article contains market analysis and price predictions. These are not guarantees. Crypto markets are volatile. Always DYOR. Not financial advice.

Also Read: Zcash Price Breaks Above $513 as Bullish Structure Signals Continued Upside

Filed Under: Cryptocurrency News, Litecoin (LTC)

Bitcoin Price Rejected at $80,000 as Technical Indicators Flash Warning Signs

By Bena Ilyas | Edited By Ammar Raza,May 17, 2026, 5:00 PM

Bitcoin price seems to be exhibiting some early indications of losing its upward momentum in the wake of its most recent gains. The current trends suggest that there are now higher levels of profits being taken out, which is preventing further growth. Overall, all eyes will now be on how the Bitcoin price holds up in the coming trading periods.

At the time of writing, BTC is trading at $78,451, with a 24-hour trading volume of $23.18 billion and a total market capitalization of $1.57 trillion. The BTC price has recorded a slight gain of 0.82% over the last 24 hours, but overall movement remains uneven as the market struggles to build stronger upward momentum.

BTC price chart
Source: CoinMarketCap

Also Read |Ethereum Price Prediction Shows Over 110% Upside Toward $4,800 Breakout Zone

Bitcoin Price Risks Correction Ahead

On May 17, 2026, a popular crypto analyst, Ali Martinez, cautioned that the Bitcoin market could be in an overheated state. According to him, the mean realized profit margins have risen to about 17%, indicating that a considerable number of players in the market are holding profitable positions. Previously, such levels were followed by increased selling pressure as people tried to book their gains, thus restraining any rise in the BTC price.

Bitcoin profit cycle chart
Source: Ali Martinez’s X Post

He further emphasized the importance of an important parallel from the past. It was the last time that the achieved profit margin touched such levels while the Bitcoin price was also under pressure amid resistance around its 200-day moving average back in March 2022. Such a scenario ultimately ended in a local top and then a downward correction.

BTC Price Loses Key Momentum

Technically, it appears that the Bitcoin price is losing momentum following a failure to remain above the mark of $80,000. The RSI  indicator fell to 48.95, which is below its average of 60.53. This indicates that sellers have gained the upper hand. Currently, the BTC price stands at $78,451, while there is strong resistance at the 200-day moving average at $81,598.

BTC technical analysis chart
Source: TradingView

Furthermore, the MACD line currently holds at 946.07, and the histogram is down at -521.02, indicating increased negative pressure. Should the sell-off continue, the Bitcoin price may head for critical support zones like $75,434 and $72,146.

Overall, the Bitcoin price is currently in a delicate phase where factors such as technical analysis and profit-taking are contributing to its direction. Even though the current support lines are not broken, the future move will be dependent on whether new buying power emerges or if selling pressure increases.

This article contains market analysis and price predictions. These are not guarantees. Crypto markets are volatile. Always DYOR. Not financial advice.

Also Read | FARTCOIN Price Analysis: Failed Breakout And Weak Support Raise Downside Risks

Filed Under: Cryptocurrency News, Bitcoin (BTC)

WIF Price Forecast: Falling Wedge Pattern Could Trigger a Bullish Move to $1.30

By Mishal Ali | Edited By Messam Raza,May 17, 2026, 4:00 PM

Dogwifhat (WIF) shows potential for a bullish rally following the weeks in consolidation in a falling wedge pattern. However, technical indicators signal weakening momentum for the WIF price with bearish shifts in trend strength.

Derivatives data reflects mixed participation, with slightly rising open interest but declining trading activity, suggesting cautious market engagement. According to CoinMarketCap, WIF is trading at $0.1972 with a daily decline of 1.36%.

WIF current price

Source: CoinMarketCap

WIF Derivative Data Point to Mixed Outlook

According to Coinglass, the WIF open interest increased by 1.20%, reaching $85.27 million, indicating a slight rise in active contracts and trader participation, suggesting improving market engagement and potentially stronger positioning or renewed confidence in derivatives markets despite short-term fluctuations and ongoing volatility in trading conditions.

WIF open interest and volume

Source: Coiglass

However, volume declined by 25.97%, reaching $67.83 million, reflecting reduced trading activity and weaker participation compared to prior levels, possibly driven by lower volatility, cautious sentiment, or a temporary market slowdown in derivatives trading conditions.

Also Read: Dogwifhat (WIF) Nears Key Support: Is a $1.35 Reversal Coming?

WIF Price Setup Hints at a Bullish Move Toward $1.30

Furthermore, the crypto analyst Jonathan Carter pointed out that WIF has formed a falling wedge in its 2-day chart, a formation known to be a sign of weakening sellers and a potential bullish trend change. 

The WIF price has been compressing as it consolidates for several weeks, and the trading volume starts rising, indicating increasing trader participation. Traders will wait for a breakout from above the resistance trendlines in coming sessions.

WIF price prediction

Source: Jonathan Carter’s X Post

Experts are now looking for a breakout trigger that would help breach the resistance level of the wedge pattern, thus paving the path for a rally. If the momentum increases, the potential targets for the WIF price will be around $0.27, $0.36, $0.48, $0.70, and $1.30. 

However, there is a possibility that the trend may become invalid due to a sudden failure in sustaining the support level and market sentiment.

WIF Technical Indicators Point to Downward Pressure

According to TradingView, the WIF price has made a double bottom pattern between March and April, causing a strong bullish trend up to around 0.26000 by early May. 

From that time, the WIF price has moved into a correction, and several bearish candles have caused a downward movement of the price to around 0.19700.

WIF technical outlook

Source: TradingView

The technical indicators have proved that there is an immediate change in the momentum of the market.

This is evident by the fact that the RSI has dropped to 45.07 and has crossed its moving average, indicating that there is selling pressure in the market. At the same time, the MACD indicator has shown a bearish crossover.

This article contains market analysis and price predictions. These are not guarantees. Crypto markets are volatile. Always DYOR. Not financial advice.

Also Read: Dogwifhat (WIF) Shows Strength After Downtrend; Bulls Target $1.35 Level

Filed Under: Cryptocurrency News, Altcoin News

JASMY Price Analysis: Breakdown Below Key Levels Signals Downside Risk

By Mishal Ali | Edited By Messam Raza,May 17, 2026, 2:00 PM

JasmyCoin (JASMY) price action turned bearish after a failed breakout and rejection from key Fibonacci levels, falling back below the 20-day SMA. Technical indicators like MACD and Bollinger Bands confirm strong downside momentum for the JASMY price, while declining open interest and trading volume reflect reduced participation and weakening market sentiment. According to CoinMarketCap, JASMY is trading at $0.005907 with a daily decline of 2.31%.

JASMY current price

Source: CoinMarketCap

JASMY Derivative Data Reveal Bearish Pressure

According to Coinglass, the JASMY open interest decreased by 20.02%, falling to $20.65 million, indicating reduced derivatives positioning and declining speculative exposure in the market. This suggests traders are becoming more cautious, with fewer active contracts and weakening sentiment across the market.

JASMY open interest and volume

Source: Coinglass

Trading volume declined by 12.39%, reaching $20.75 million, reflecting reduced market activity and lower participation levels. This suggests weakening momentum among traders and decreased engagement in the market compared to prior periods, indicating a slowdown in trading interest.

Also Read: JASMY Price Targets $0.0099 After an Explosive Breakout Above $0.006

JASMY Price Slides Below Critical Fib Zones

Furthermore, the data from The JASMY Empire suggests that the JASMY price starts losing power after an extensive Fibonacci retracement from its peak at $0.01 towards cycle lows. 

The failure of the 0.5 level at $0.00736 is immediately followed by rejection beneath the 0.382 level at $0.00668. If the JASMY price move continues lower, attention turns towards the 0.236 level at $0.00585 for the next probable area of reaction.

JASMY price prediction

Source: The JASMY Empire’s X Post

The extended outlook is still bearish for the JASMY price, as the market has barely hit the 13-week mark of its present trend downward. Further declines may well be expected, especially if the price fails to convincingly break above the 0.5 Fibonacci retracement level. 

Breaking above this level may reverse the momentum, which might indicate the beginning of a reversal pattern currently taking shape.

Technical Indicators Point to Increasing Selling Pressure

According to TradingView, the JASMY price remained calm for two months while ranging in a tight range from $0.0051 to $0.0060, after which it entered into May with an impressive break higher, hitting its peak at $0.0079. 

However, the advance became overstretched above the Bollinger Bands, thus triggering a quick reversal back down, breaking below the 20-day SMA to test a new support around $0.00591.

JASMY price analysis

Source: TradingView

The momentum oscillator is giving a strong indication of this current bearish trend. There is a significant increase in the Bollinger Bands at the rally, but there is a pullback to the bottom of the bands at $0.00501. 

In addition, the MACD indicator has crossed below the signal line while the histogram is negative, which also points to a downward movement for the JASMY price.

This article contains market analysis and price predictions. These are not guarantees. Crypto markets are volatile. Always DYOR. Not financial advice.

Also Read: JASMY Price Prediction: Bullish Structure Points to a Rally Toward $0.0099

Filed Under: Cryptocurrency News, Altcoin News

  • « Go to Previous Page
  • Page 1
  • Interim pages omitted …
  • Page 12
  • Page 13
  • Page 14
  • Page 15
  • Page 16
  • Interim pages omitted …
  • Page 3615
  • Go to Next Page »

Primary Sidebar

Recent Posts

  • Boerse Stuttgart, Societe Generale & flatexDEGIRO Partner for Tokenized Securities Platform May 22, 2026
  • JASMY Price Breakout Above Weekly High Could Trigger Strong Rally to $0.27 May 22, 2026
  • Why RLUSD Stablecoin Cannot Replace XRP in Digital Asset Routing Explained May 21, 2026
  • Circle-Backed QCAD StableFX Enables Real-Time Institutional FX Settlement May 21, 2026
  • Avalanche Stablecoin Partnerships Fuel Growth as AVAX Eyes $13.52 Level May 21, 2026

Footer

News

  • Latest News
  • Altcoin News
  • Bitcoin (BTC)
  • Blockchain
  • Tron (TRX)
  • World

Digest

  • Meet the Founder
  • Price Winning Article
  • DeFi
  • Cyber Security
  • Crypto Scam

Industry

  • Project Review
  • Technology
  • Fintech
  • Tron Exchange
  • New in Town

Tron Universe

  • Event and Tron Parties
  • New in Town
  • Tron Tokens

FOLLOW US

  • Facebook
  • Telegram
  • Twitter
  • Linkedin

Editorial Policy | Privacy Policy | Disclaimer | Terms and Conditions | Masthead

Copyright © 2026 · Tron Weekly. All Rights Reserved. NOTE: Tron Weekly is an independent crypto news site that adheres to the strict journalism policy anchored on transparency, trust, and objectivity, we have no affiliation with the TRON Foundation, its founder Justin Sun or any other cryptocurrency firm.