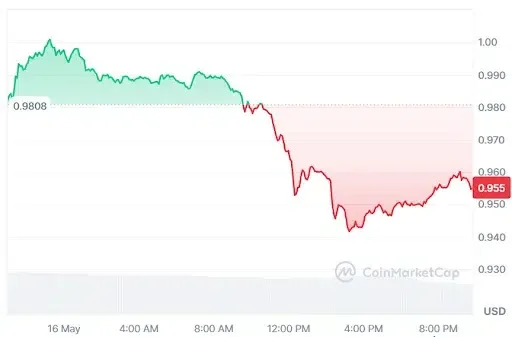
FARTCOIN shows a failed breakout and has fallen back into its previous range, signaling weak bullish momentum and uncertainty. Technical indicators remain bearish, with the FARTCOIN price below key moving averages and MACD confirming downside pressure. Derivatives activity also weakened, reflecting reduced participation and lower trader commitment. According to CoinMarketCap, FARTCOIN is trading at $0.1937 with a daily decline of 1.74%.
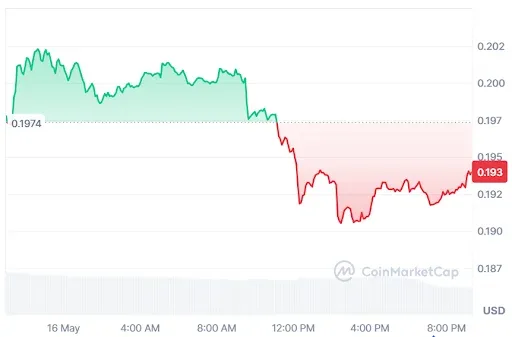
Source: CoinMarketCap
FARTCOIN Derivative Data Point to Bearish Pressure
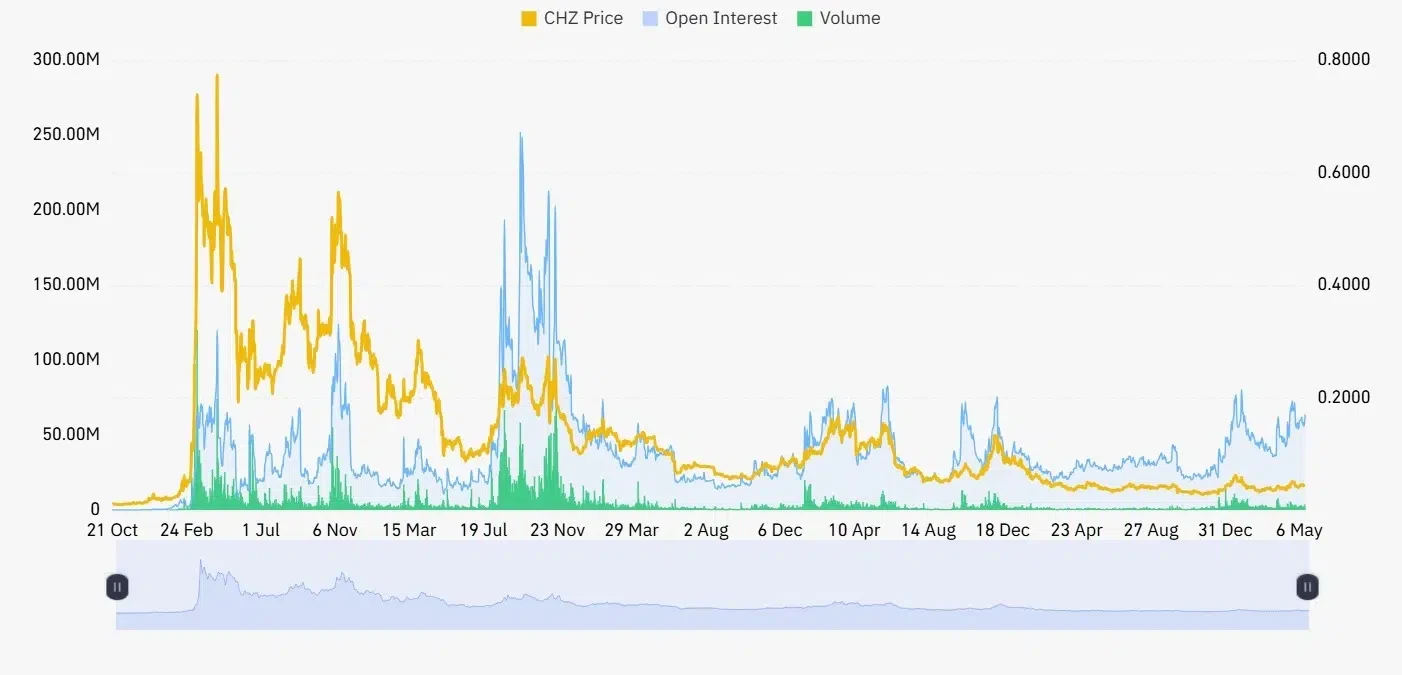
According to Coinglass, the FARTCOIN open interest decreased by 5.17%, settling at $142.76 million, indicating a modest reduction in outstanding derivatives contracts and slightly lower trader commitment, reflecting reduced positioning activity and softer market participation.

Source: Coinglass
Trading volume fell by 39.92%, reaching $151.30 million, signaling reduced market activity and weaker transaction flow compared to the previous period, with declining participation and softer momentum across the derivatives market.
Also Read: FARTCOIN Falling Wedge Pattern Signals Potential Breakout Toward $1.2
FARTCOIN Price Update: Failed Breakout Raises Uncertainty
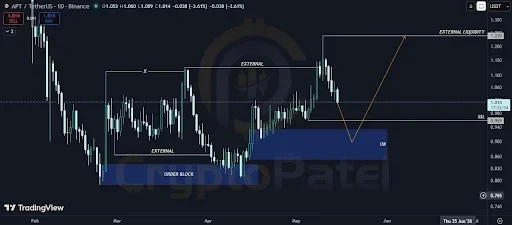
Furthermore, the crypto analyst Scient pointed out that The FARTCOIN price has attracted a lot of attention as it attempts to retrace an important diagonal trendline on the 1D time frame.
This formation implies that there could be a potential bearish reversal for the FARTCOIN price, but the absence of a critical triggering factor makes trading decisions tricky in the long term.
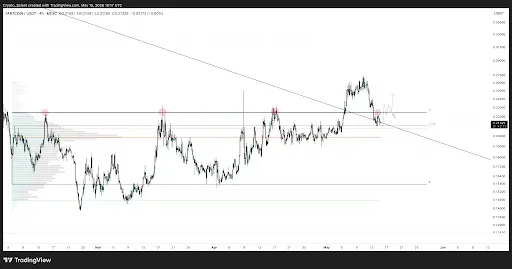
Source: Scient’s X Post
In the 4H timeframe, the FARTCOIN price action has returned to its previous range following a failed breakout attempt, exhibiting weak follow-through from bulls.
In order for a bullish pattern to be formed, a reversal bounce from trend support should occur, along with a shift in range resistance levels to support.
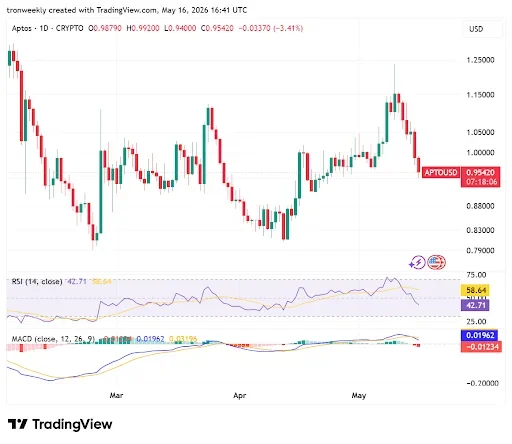
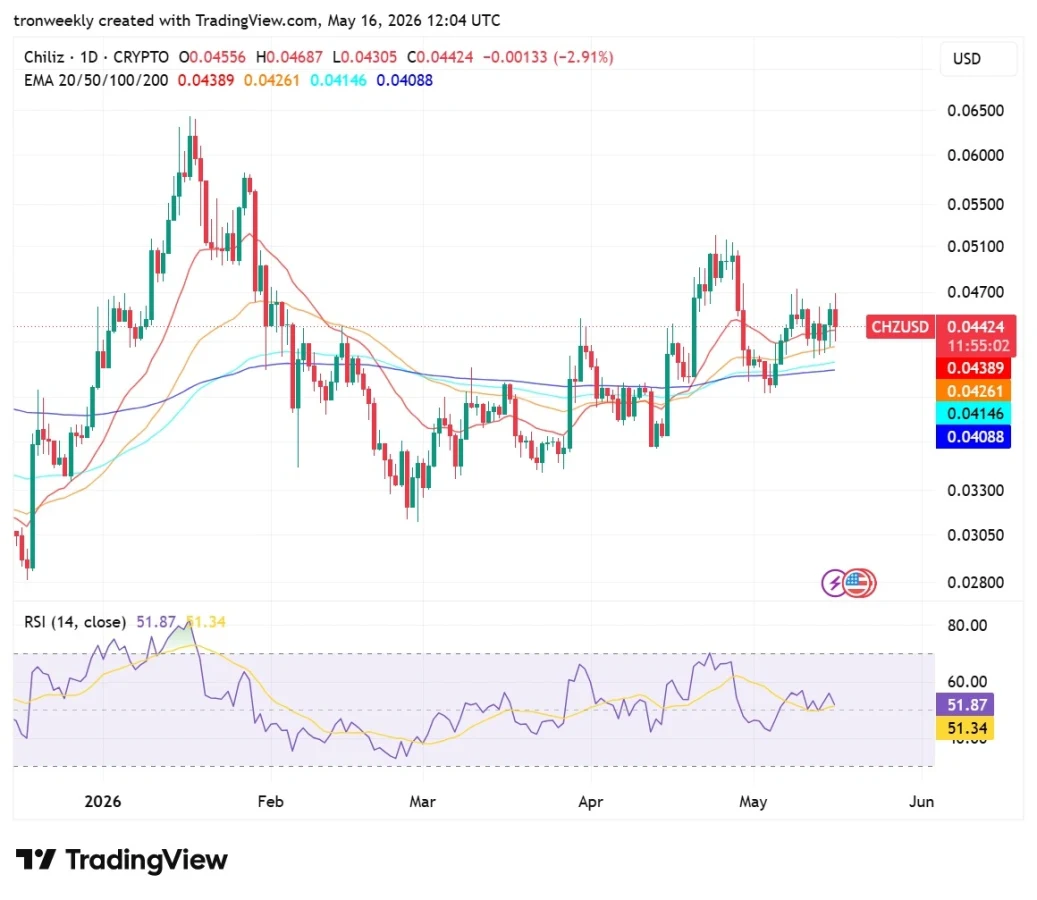
Technical Indicators Point to Strong Downward Pressure
According to TradingView, FARTCOIN made a quick turnaround following its May high of $0.2686. The FARTCOIN price has fallen below its 20-day moving average of $0.2217 and has lost 3.19%, closing at $0.1941. It appears that the FARTCOIN price is making an attempt to test the lower Bollinger Band support level

Source: TradingView
The technical signals clearly confirm the existence of the ongoing downtrend in the market. This is evident from the bearish MACD cross, where the MACD indicator has moved decisively below its signal line.
Furthermore, the MACD histogram has changed to red, meaning that the sellers have gained dominance over the buyers.
This article contains market analysis and price predictions. These are not guarantees. Crypto markets are volatile. Always DYOR. Not financial advice.
Also Read: Fartcoin Consolidates as Market Awaits Breakout Signal Confirmation